|
|
GTSM in SAN JUAN BAUTISTA, CALIFORNIA
<
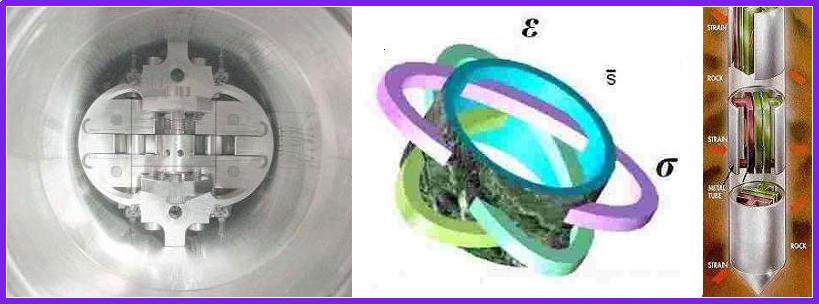
High precision and high stability measurements
of the horizontal strain field in a region are made in California
using a Gladwin Tensor Strain Measurement instrument (GTSM). These instruments
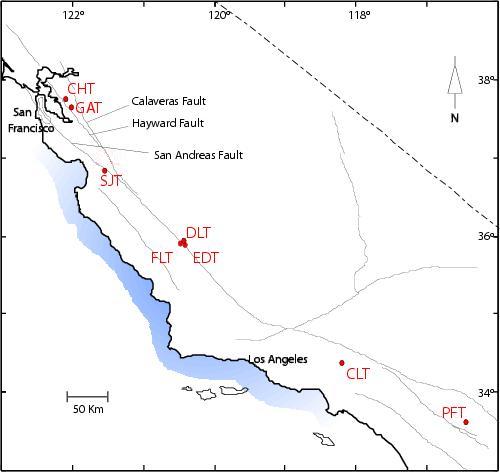
are installed at a depth of 100-200 metres at 7 sites in California. The
sites are shown in red in the accompanying map.
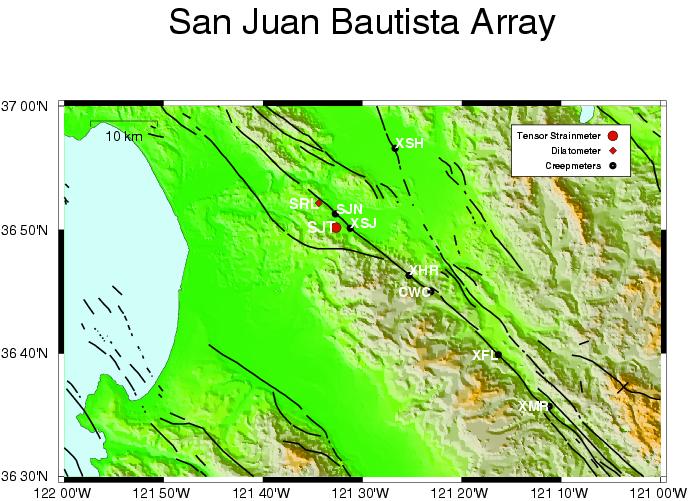
SJT is close to San Juan
Bautista to the south of San Francisco, in an array consisting presently
of USGS installed creepmeters XSJ, XHR, CWC,CWN, and XMR..
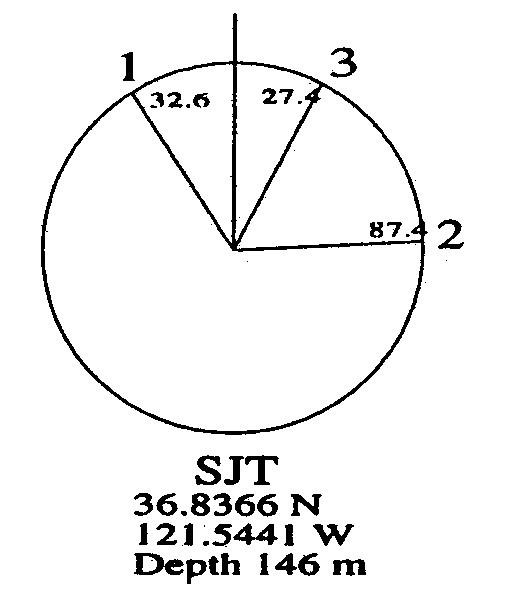
Gauge angles
- 1. 327.4 E of N
- 2. 267.4 E of N
- 3. 207.4 E of N
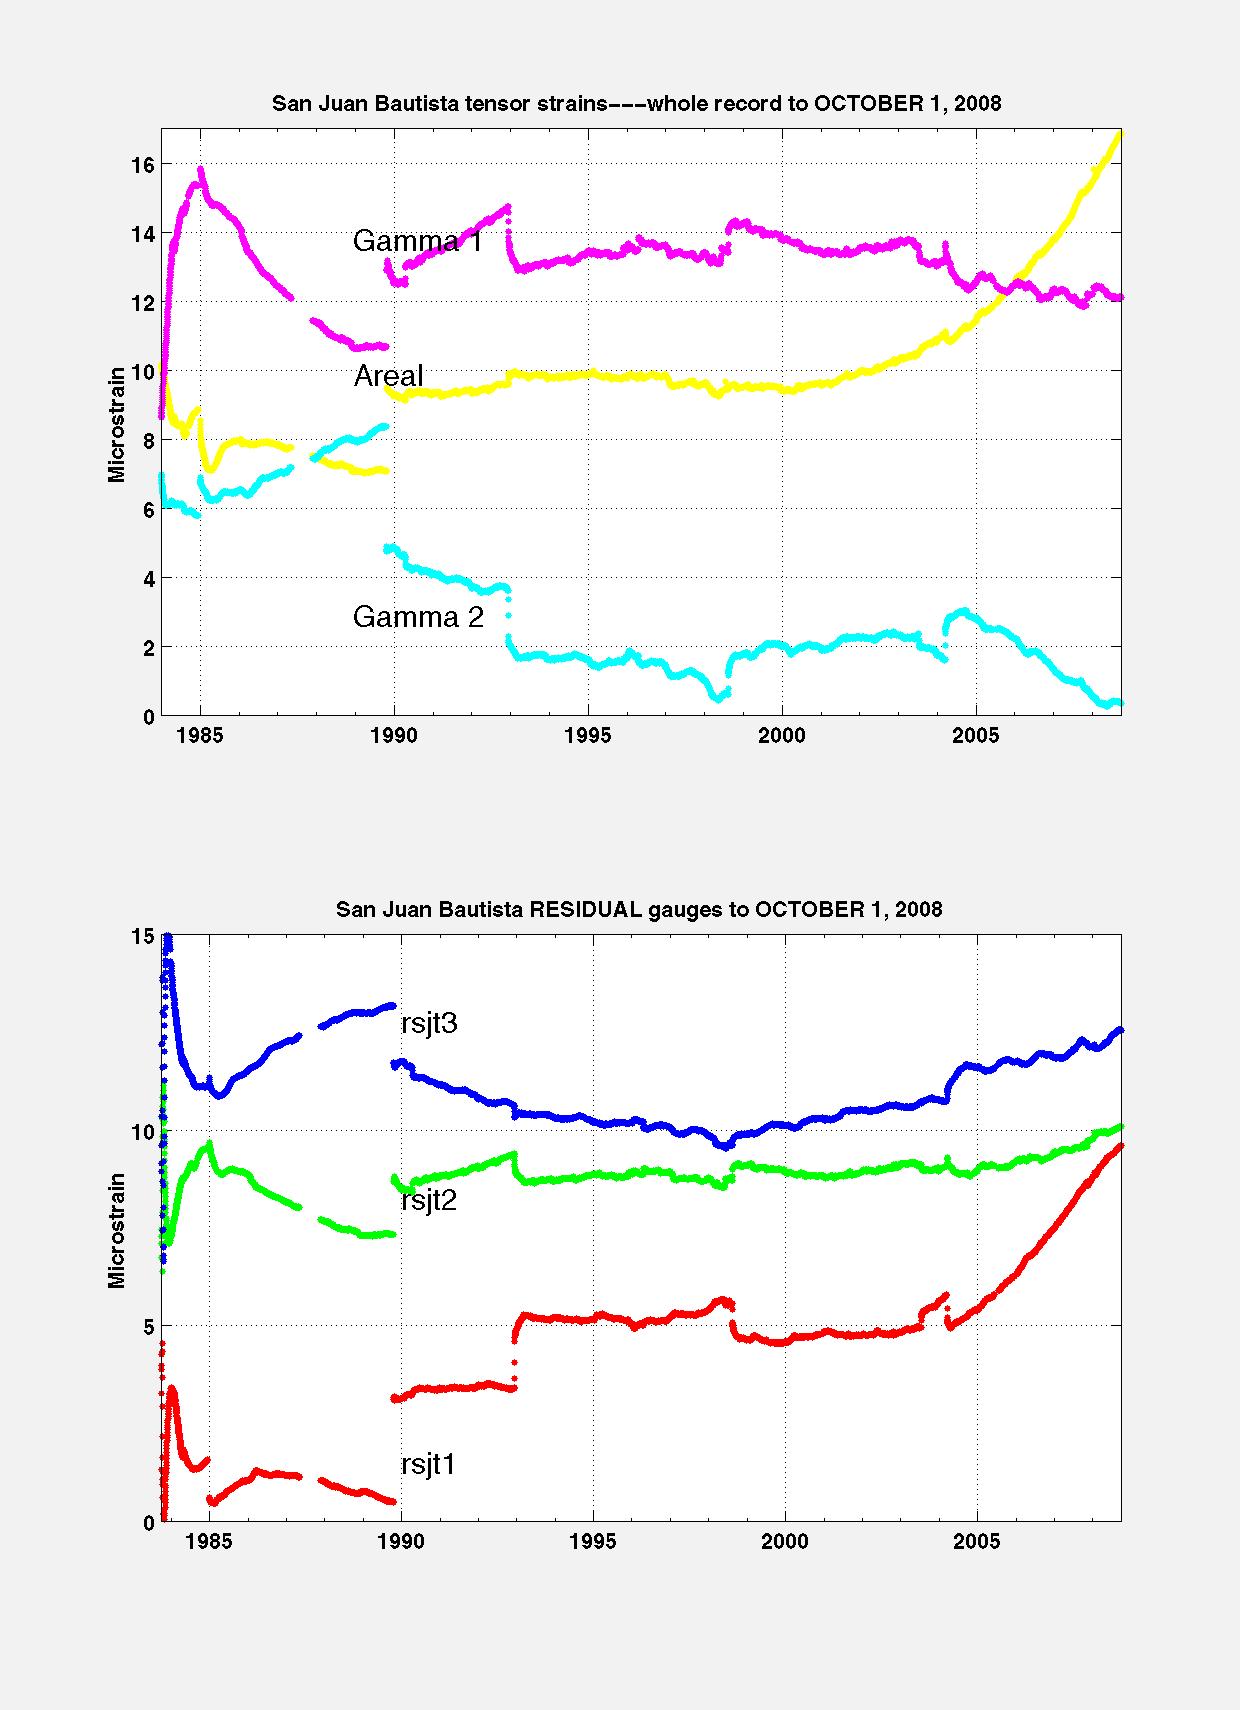
These instruments provide 3 component strain data on
- Long term strain accumulation. Long
term data records at this site (SJT) are available.
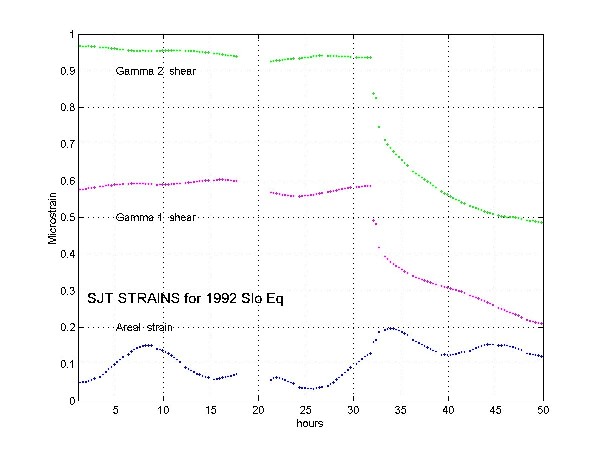
- Medium term strain changes associated with earthquake activity
and other fault processes. The sample
data shows a slow earthquake sequence recorded at SJT in 1992.
- Coseismic strain offsets useful for constraining earthquake
source mechanisms.
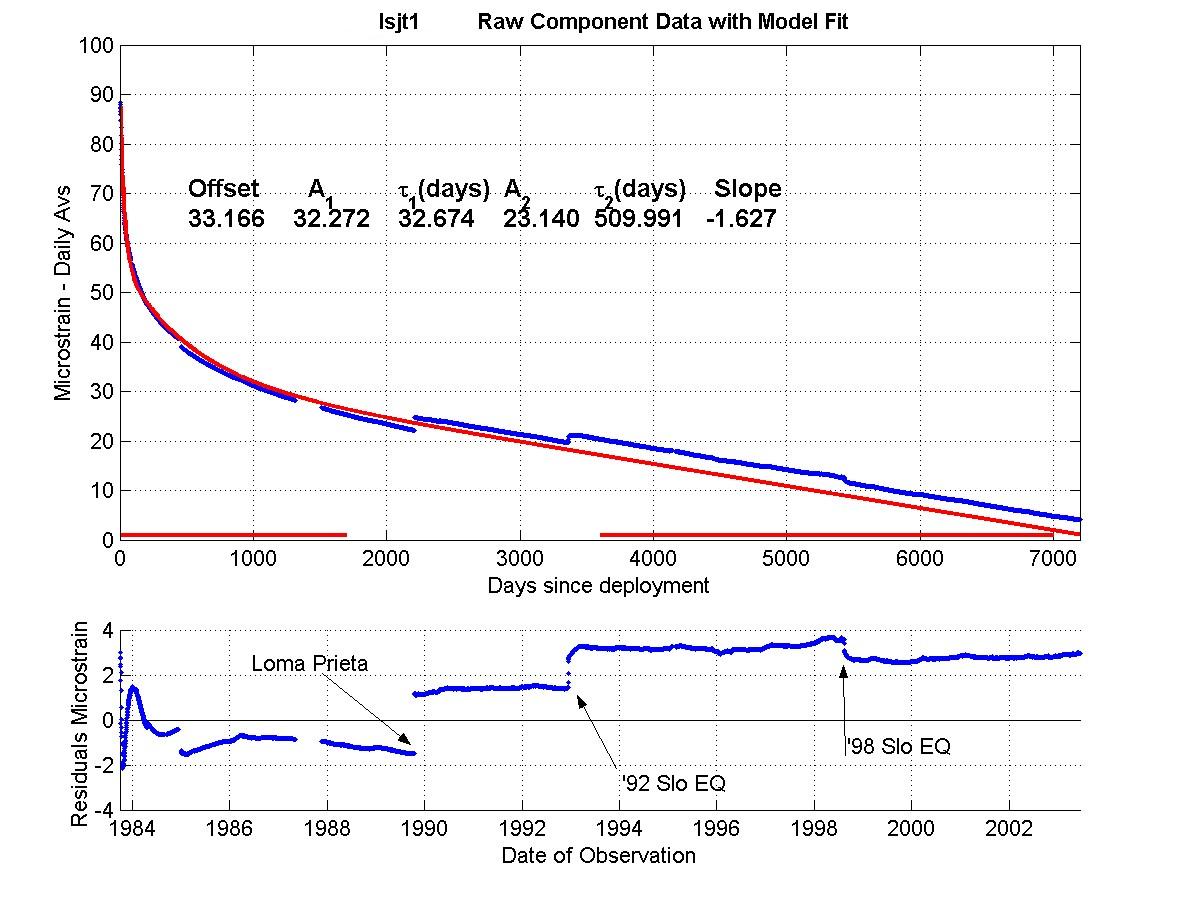
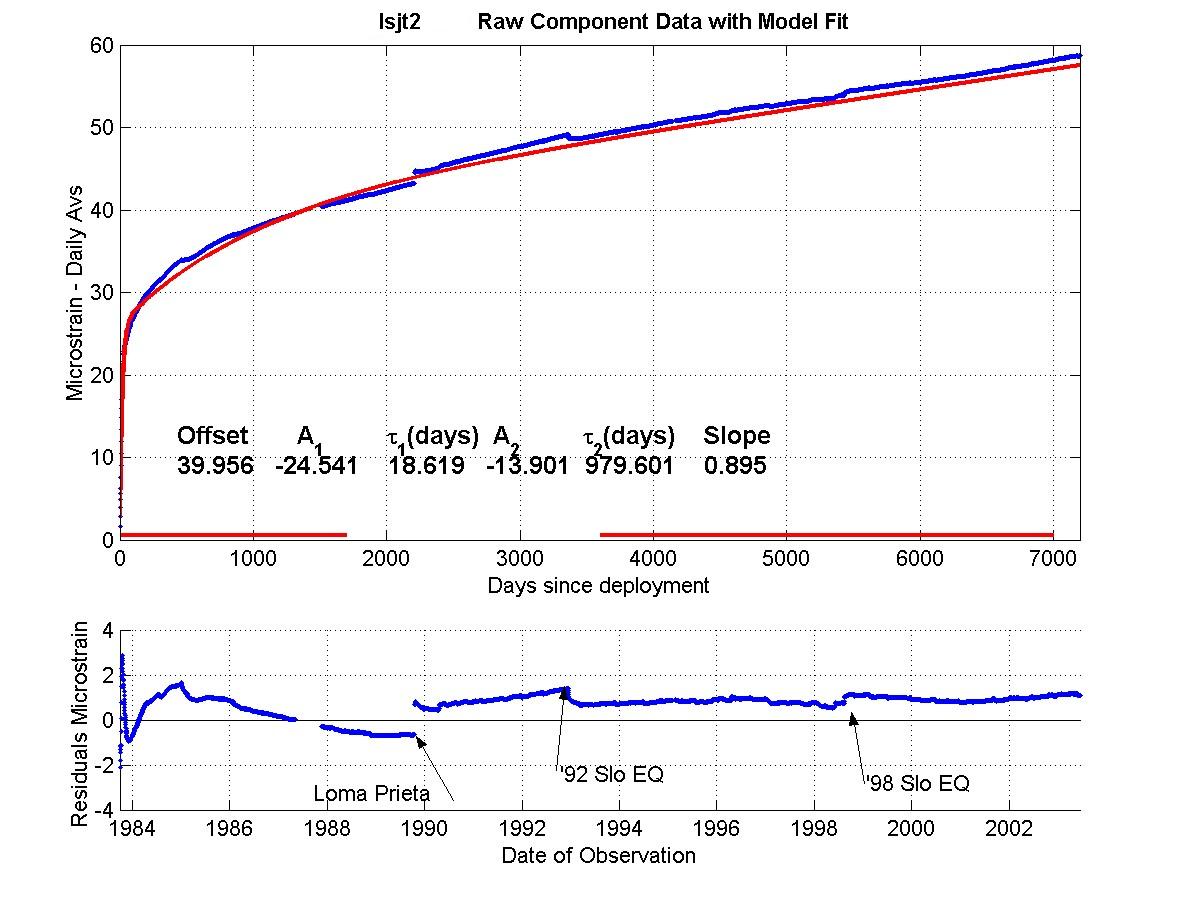
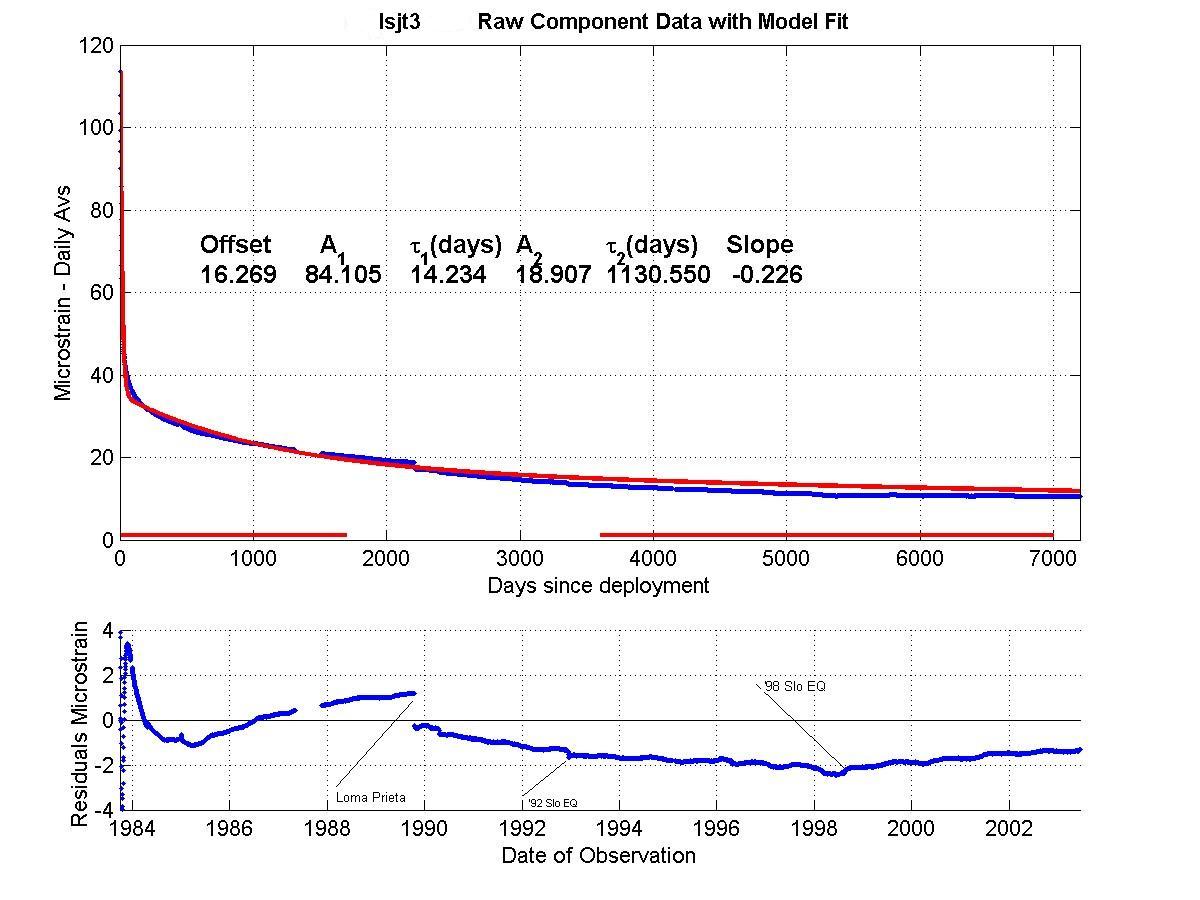
Raw, exponential models, and residual plots for each measured
channel are shown for gauge
1, gauge 2, and for
gauge 3.
Note that the gauge residuals have a Y axis scale range of +/- 4 microstrain
for each component, and show that excluding known tectonic events, all
variation in gauge strain rates have been less than +/- 0.6 microstrain
per year for the whole of the 20 year record..
The residual linear borehole recovery strain rate over the total record
is shown in microstrain/year as the "slope" on each plot.
Residual data are recovered from the raw data by extracting least squares
fitted exponential(s) and a linear function which describe the processes
of curing of the grout and recovery of the borehole, after drilling
and installation disturbance of the virgin stress field.
Regions used in the least squares fitting are marked in red on the
X axis, and the fit parameters are printed in the upper panelof
the figure and are also tabulated
elsewhere.
In August 2003, the borehole recovery exponentials
were updated from values determined in the early 1990's to incorporate
the additional 10 years of data length now available. Changes of
strain rates calculated from these residuals are unaffected by the exponential
removal procedure and allow the very long term stability(see
gauge 1 , gauge 2, and
gauge 3) of the instruments to be quantified.
Data plots of interest:
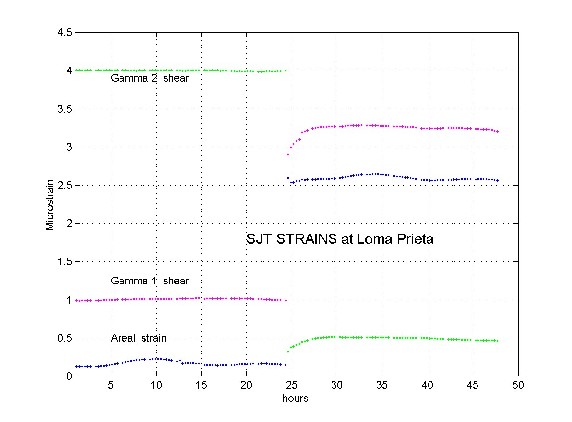
- October 17, 1989 Mag 7.1 Loma Prieta : event
detail plot
- December 12, 1992 Mag 4.8 'Slow quake' : event
detail plot
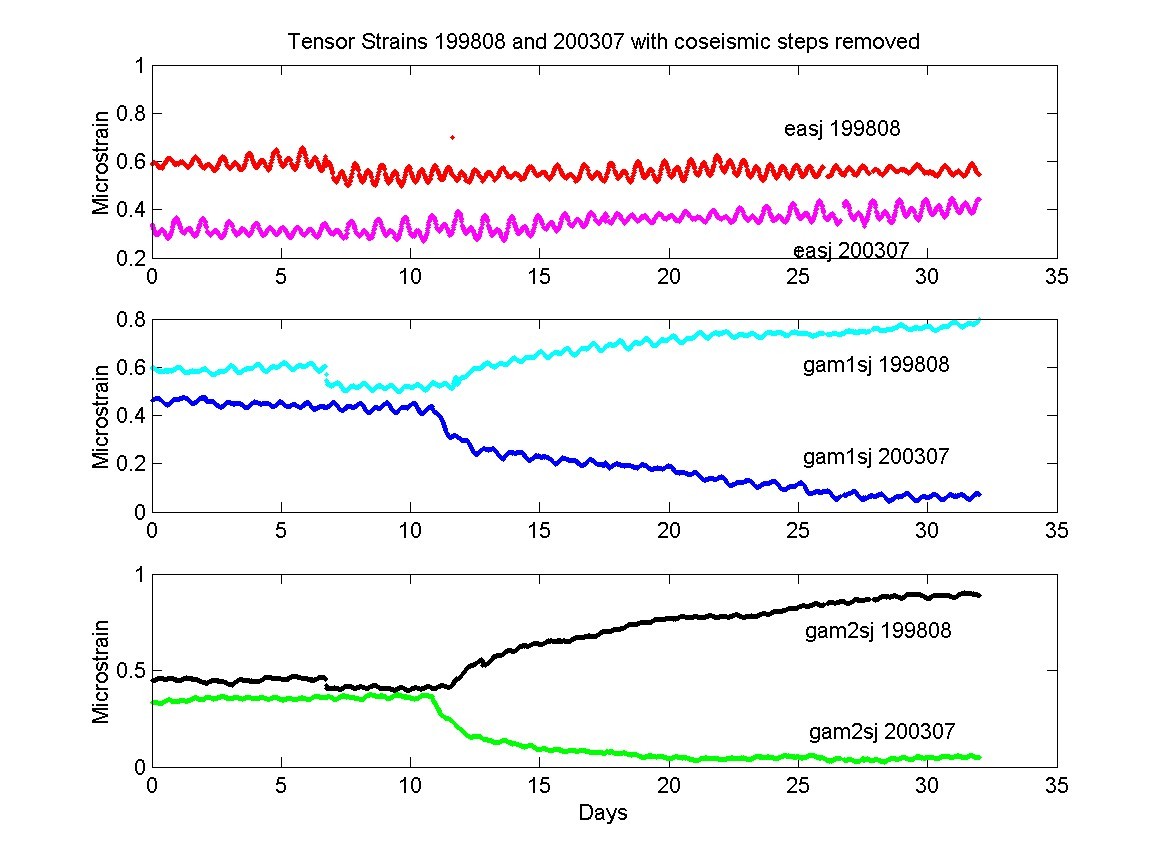
- August 12, 1998 Mag 5.5 'Slow quake' event 12km distant: short
plot and long plot
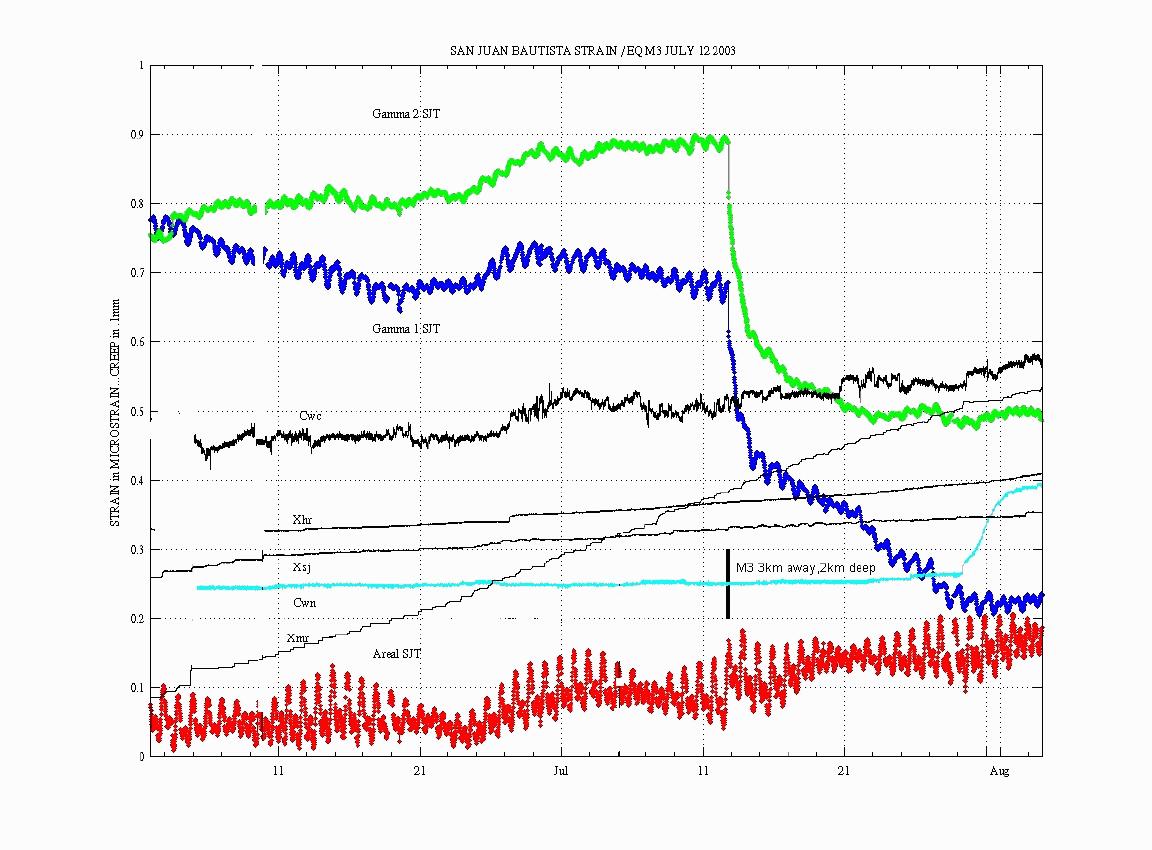
- July 13, 2003 'Slow quake' of apparent magnitude 4.5 associated
with a Mag 3 seismic event
about 3 km to the west of the site. Note that apart from a small
co-seismic step, this event is present only in the shears, and is
not seen at the surface by any of the regions creepmeters. A small
creep event, possibly associated, occurred at CWN site on July 29.
- Areal co seismic = +19.4ne
- Areal aseismic = 0 ne
- Gamma 1 co-seismic = -71.7ne
- Gamma 1 aseismic = -410ne over 17 days
- Gamma 2 co-seismic = -71.6ne
- Gamma 2 aseismic = -310ne over 10 days
Comparison of this event
with the 98 Slow quake indicates they are of similar magnitude.
-
Preliminary processing of San Simeon M6.5 as seen
at our GTSM sites at DonnaLee, and Frohlich in Parkfield, and for
San Juan Bautista.
Coseismic steps are approximately:-
DLT
FLT
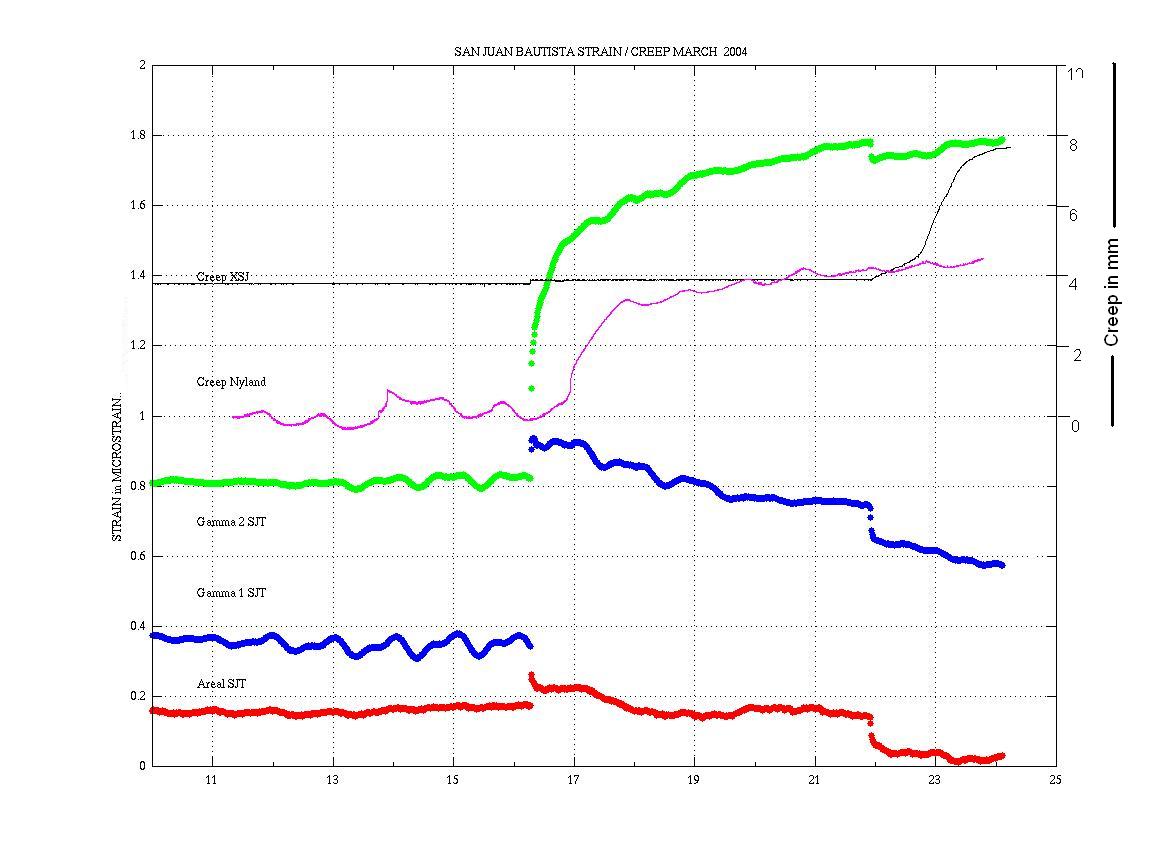
- March 16, 2004 'Slow quake' of apparent magnitude 5
associated with a Mag 4.3 seismic event
3 miles SE of SJT instrument, and accompanied by creep at
Nyland creepmeter a day later, and followed by 'catch-up' strain
creep event( the 39th in the suite-see Gladwin et al,1994 ) with
XSJ creepmeter 6days later
LARGE SCALE OBSERVED STRAIN and TILT
There are accumulating strain rate and tilt rate changes which began in 2000
and continued since then). This change of strain rate appears to be over an extensive
area.
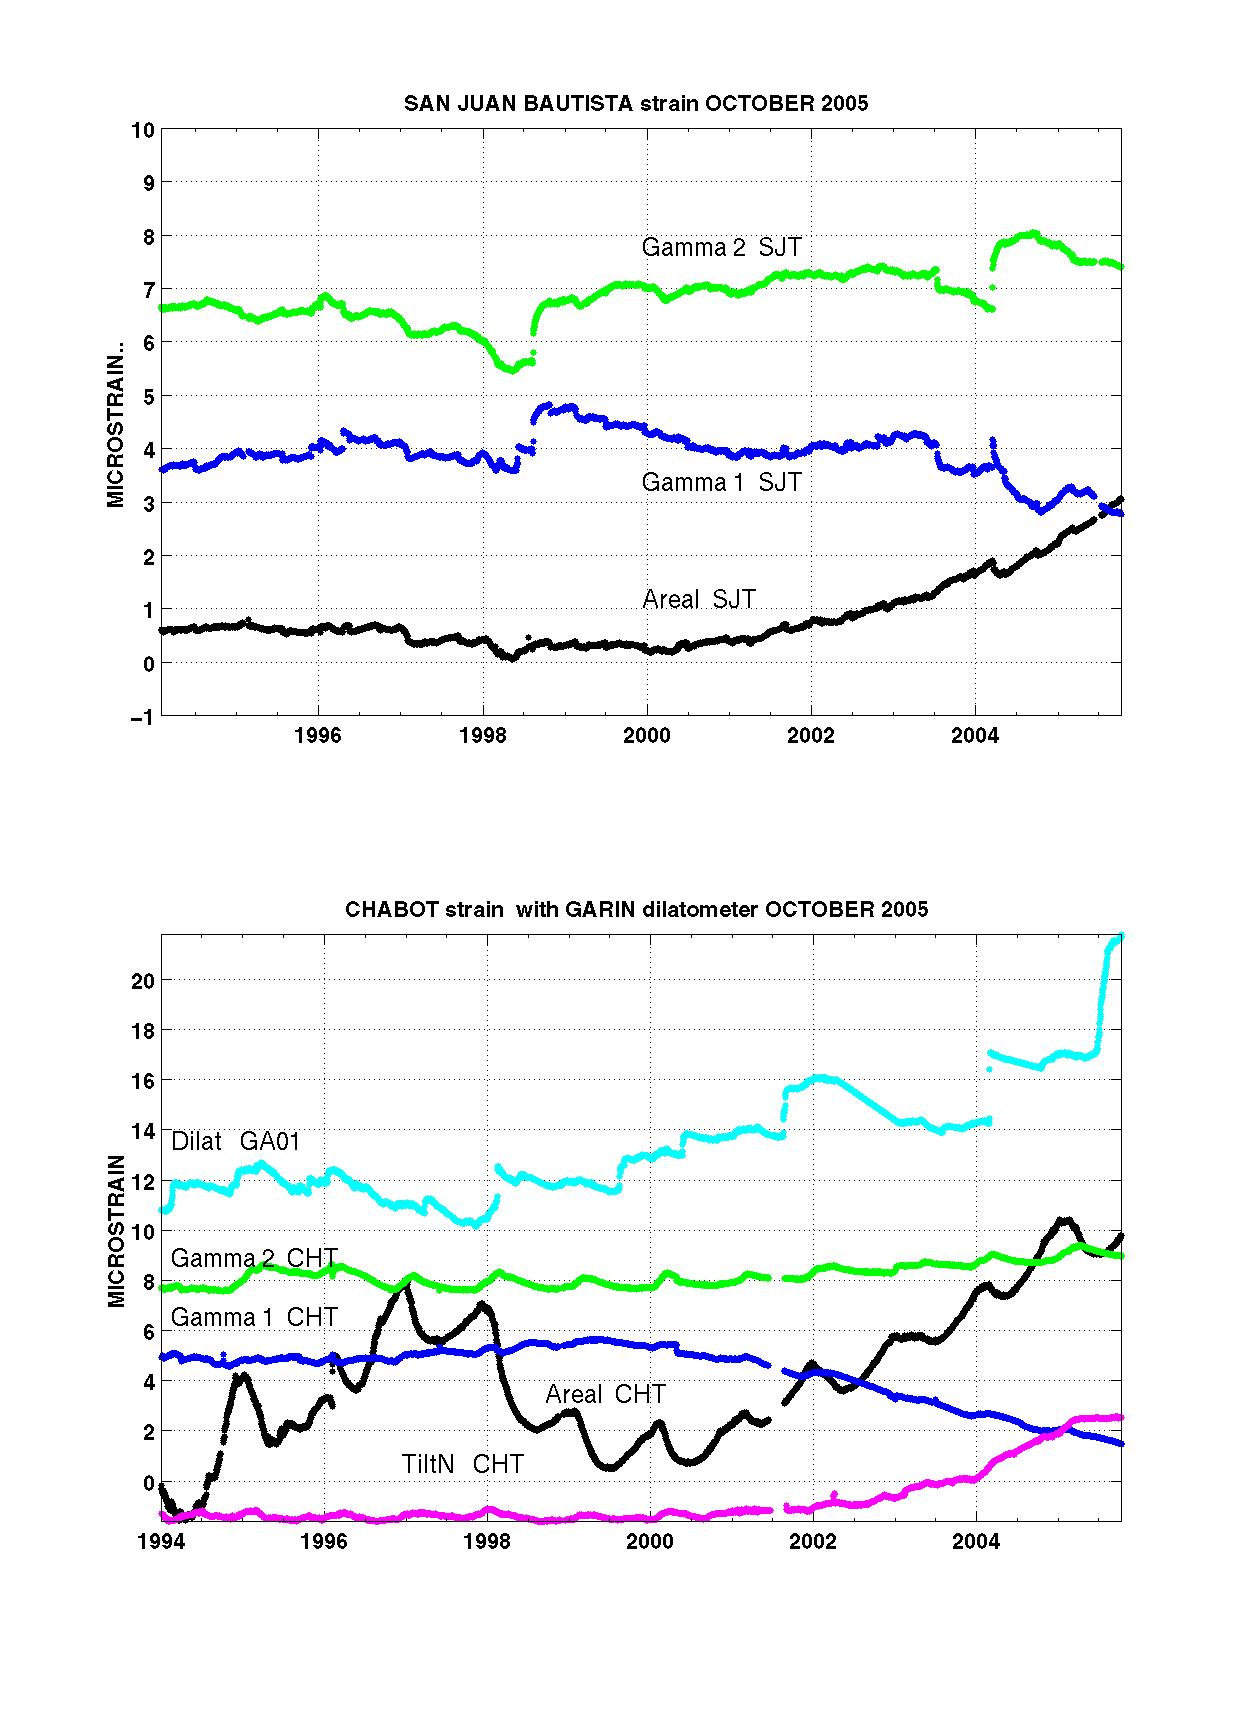
Data for the 11 year period ending October 2005 for the two stations SJT and CHT and
the Sacks-Evertson dilatometer at Garin (cyan trace). These sites are far apart and
totally independent, yet the time signatures and amplitude scaling of the anomalous
responses in areal strain at SJT and Gamma1 strain at CHT in San Francisco Bay Area are remarkably similar.
If it continues, it represents an anomaly at a spatial scale not previously identified
in this project. The change in strain rate is approximately 0.6 microstrain
per year at SJT and nearly 1 microstrain per year in Gamma1 at CHT, and should
be detectable in GPS data for the time period. The effect is confirmed at CHT by
the independent tilt channel NS. At both sites the changes are almost undisturbed
by the SJT slowquake of March 2004 or the Parkfield event in September,2004.
The component data from all the miniPBO sites in San Francisco Bay area have also been
residualised and examined for trend changes. However, all of these sites are under
4 years since installation, and corroborative signals would not be expected to be
seen, especially as the changes seen in the East bay sites CHT and GAT began just
before the miniPBO installation.
- For SJT, raw data is in instrument counts
- linearised data is in nominal nanostrain
- strain data is in microstrain
Some other related sites :
- Tensor strain in Southern California
- Tensor strain in California
- Tensor strain in San Francisco Bay
- Tensor Strain at Parkfield
- Fault/Volcano
monitoring in California for real-time, but UNCHECKED ,tensor
strain data
|
