|
|
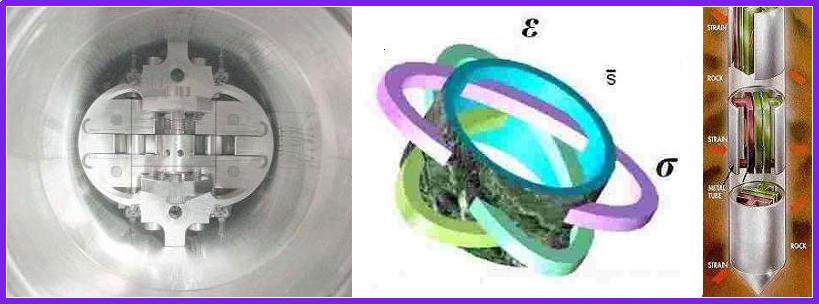
GTSM in PARKFIELD, CALIFORNIA
High precision and high stability measurements
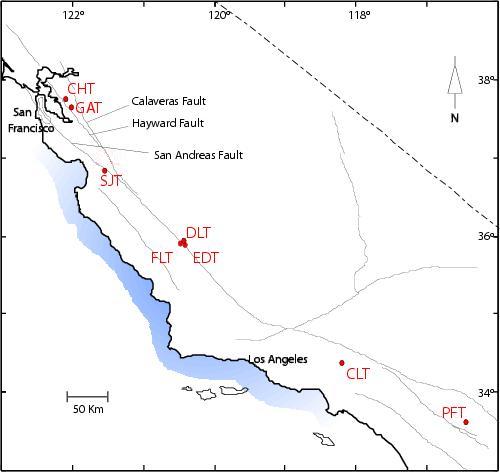
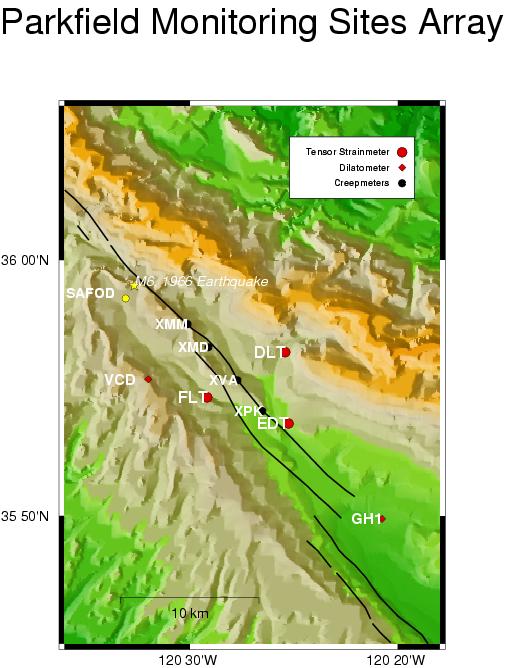
of the horizontal strain field in a region are made in California using
a Borehole Tensor Strain Measurement instrument (BTSM). These instruments
are installed at a depth of 100-200 metres at 8 sites in California. The
sites are shown in red in the accompanying map.
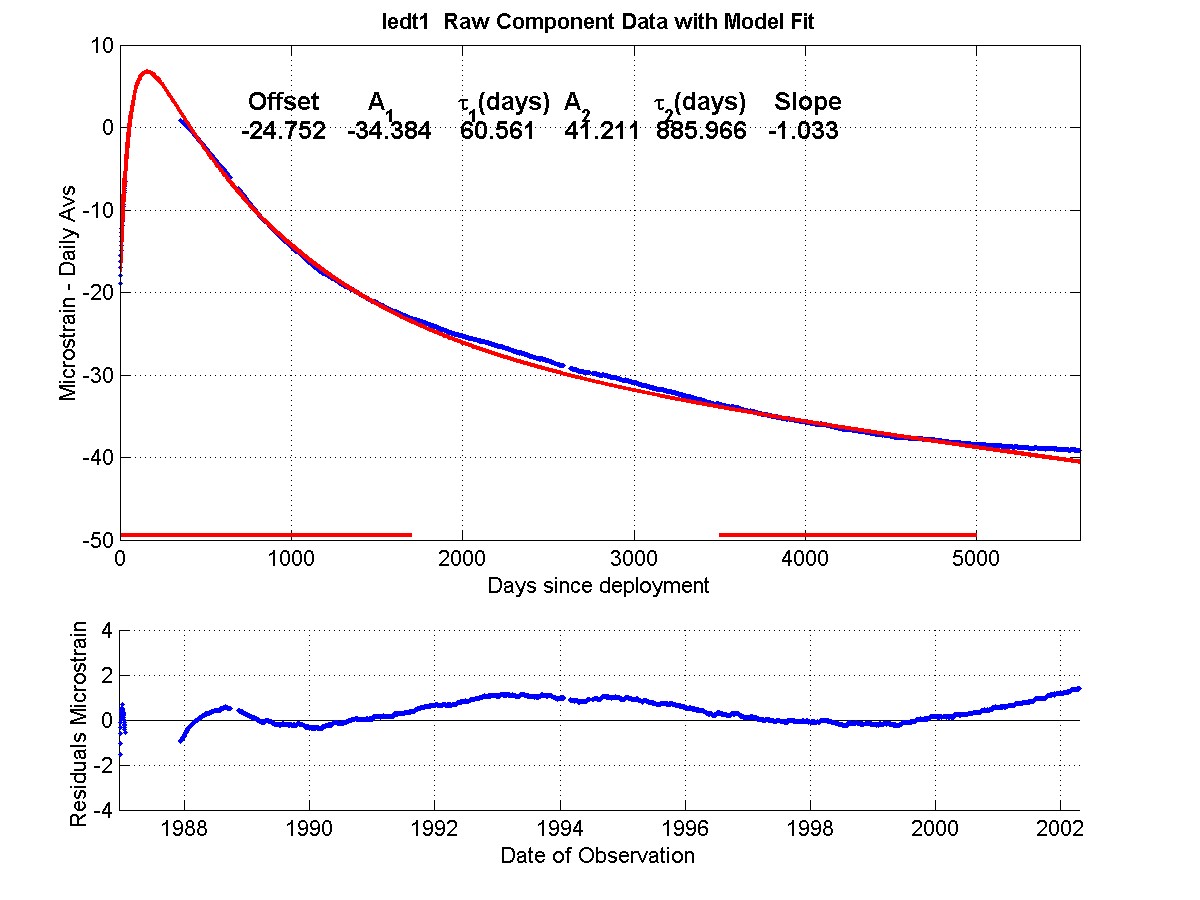
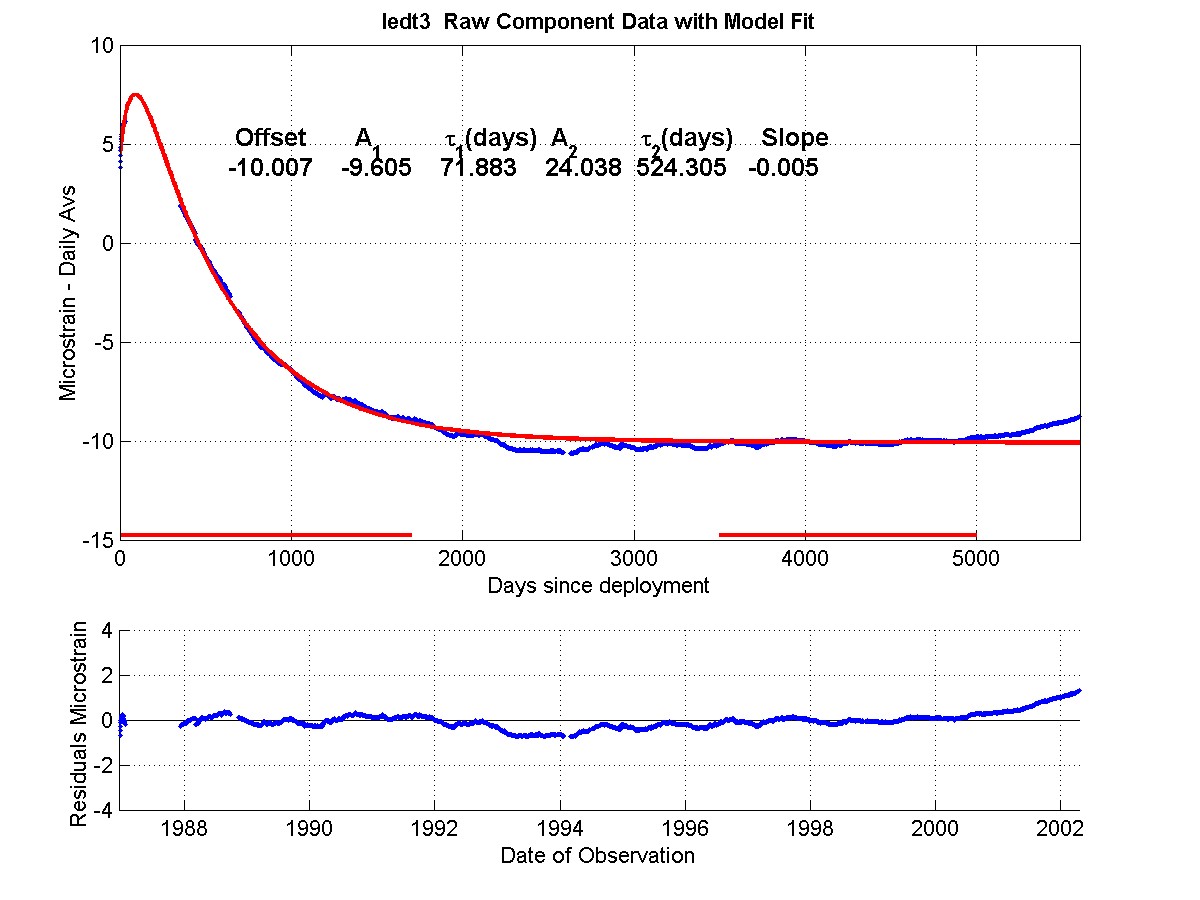
Eades - EDT
 Gauge angles
- 1. 5.75 E of N
- 2. 125.75 E of N
- 3. 65.75 E of N
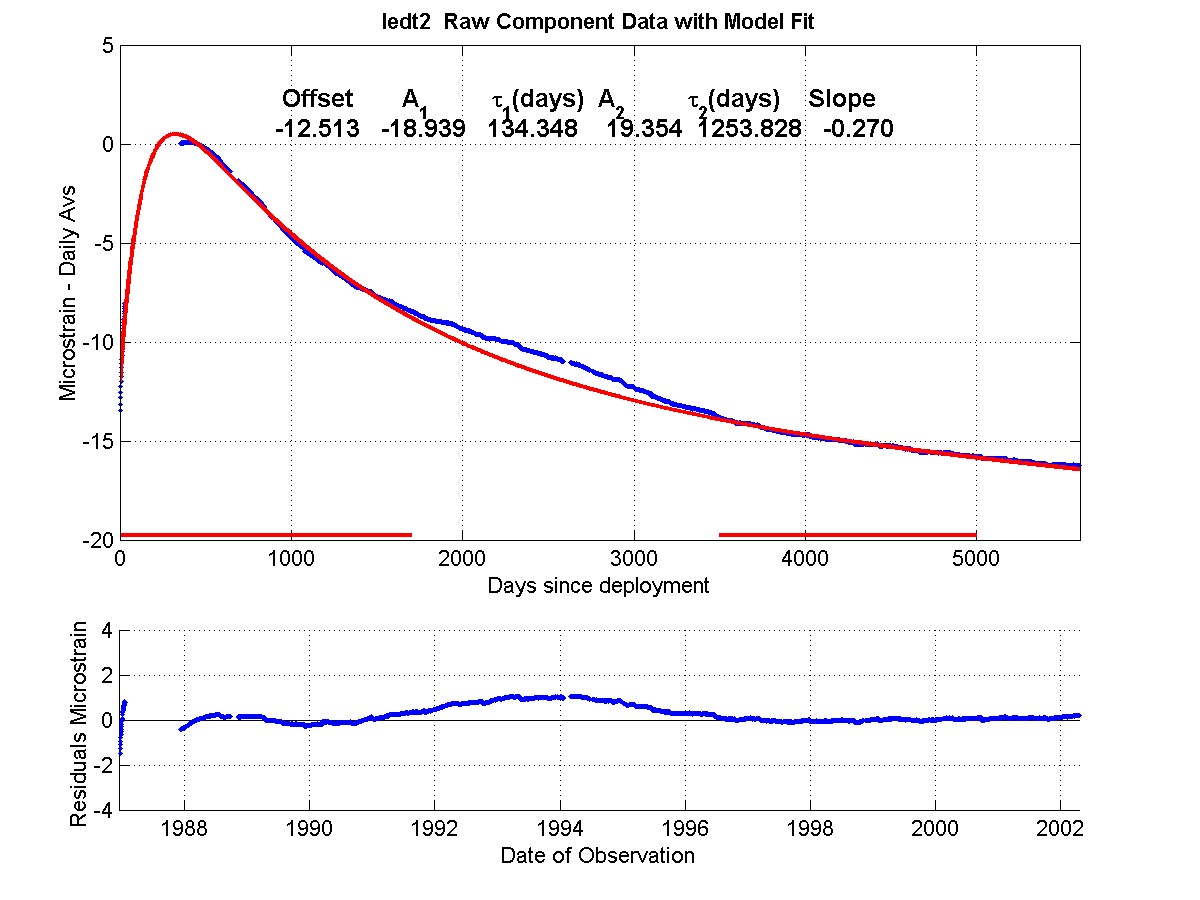
Raw, exponential models, and residual plots for each measured
channel are shown for gauge 1,
gauge 2, and for gauge
3.
Note that the gauge residuals have a Y axis scale range of +/- 4 microstrain
for each component, and show that excluding known tectonic events, all
variation in gauge strain rates have been less than +/- 0.1 microstrain
per year for the whole of the 16 year record,(1986 - 2002).
The residual linear borehole recovery strain rate over the total record
is shown in microstrain/year as the "slope" on each plot.
Residual data are recovered from the raw data by extracting least squares
fitted exponential(s) and a linear function which describe the processes
of curing of the grout and recovery of the borehole, after drilling and
installation disturbance of the virgin stress field.
Regions used in the least squares fitting are marked in red on the X
axis, and the fit parameters are printed in the upper panelof the
figure and are also tabulated
elsewhere.
In August 2003, the borehole recovery exponentials
were updated from values determined in the early 1990's to incorporate
the additional 10 years of data length now available. Changes of strain
rates calculated from these residuals are unaffected by the exponential
removal procedure and allow the very long term stability(see
gauge 1 , gauge 2, and
gauge 3) of the instruments to be quantified.
.
HISTORY
Raw gauge data for this site shows uphole electronics affected by diurnal
temperature variations.Temperature correction is applied to linearised
gauge data before producing strain data for the final archive.
This station was taken off-line on April 24 2002, due to failure of
the downhole electronics. This resulted from leakage, eventually after
16 years, from damage to the downhole cable during installation.
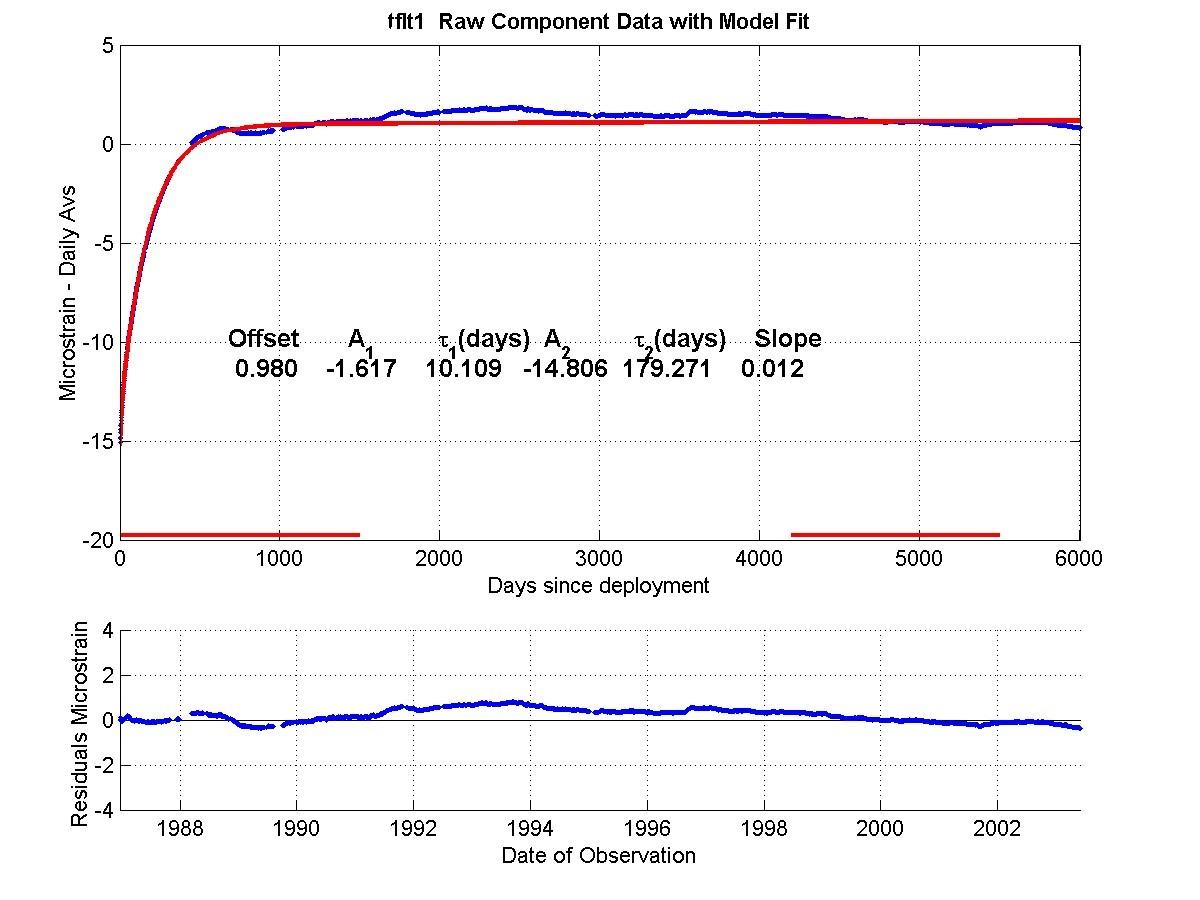
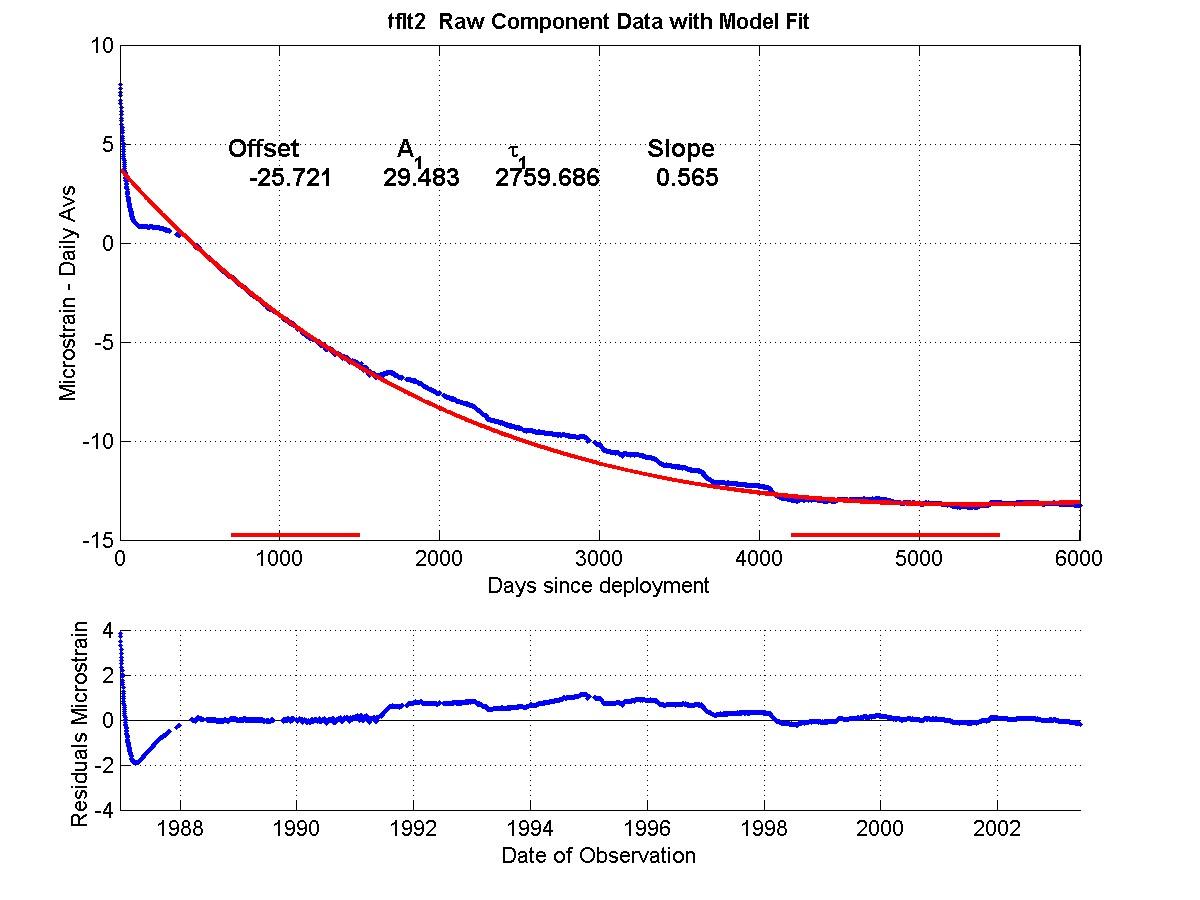
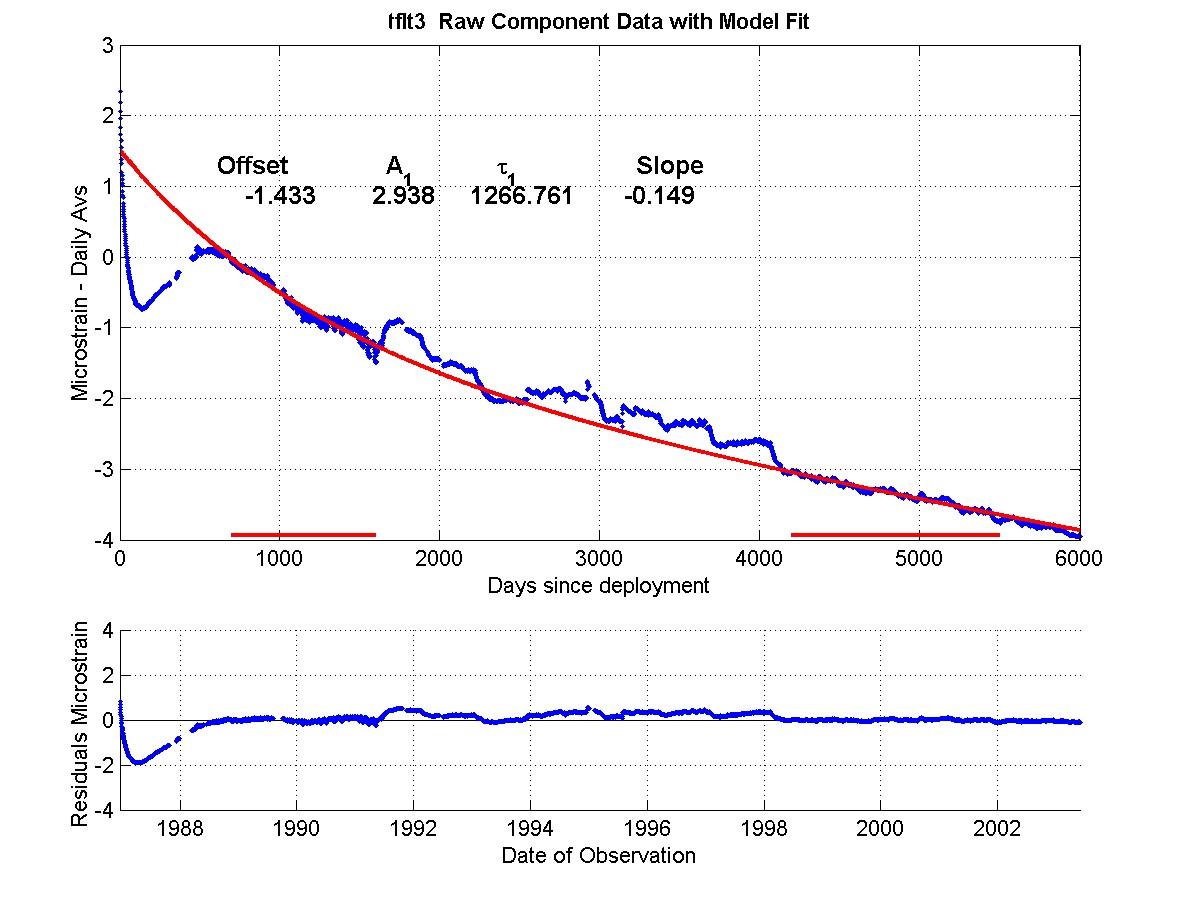
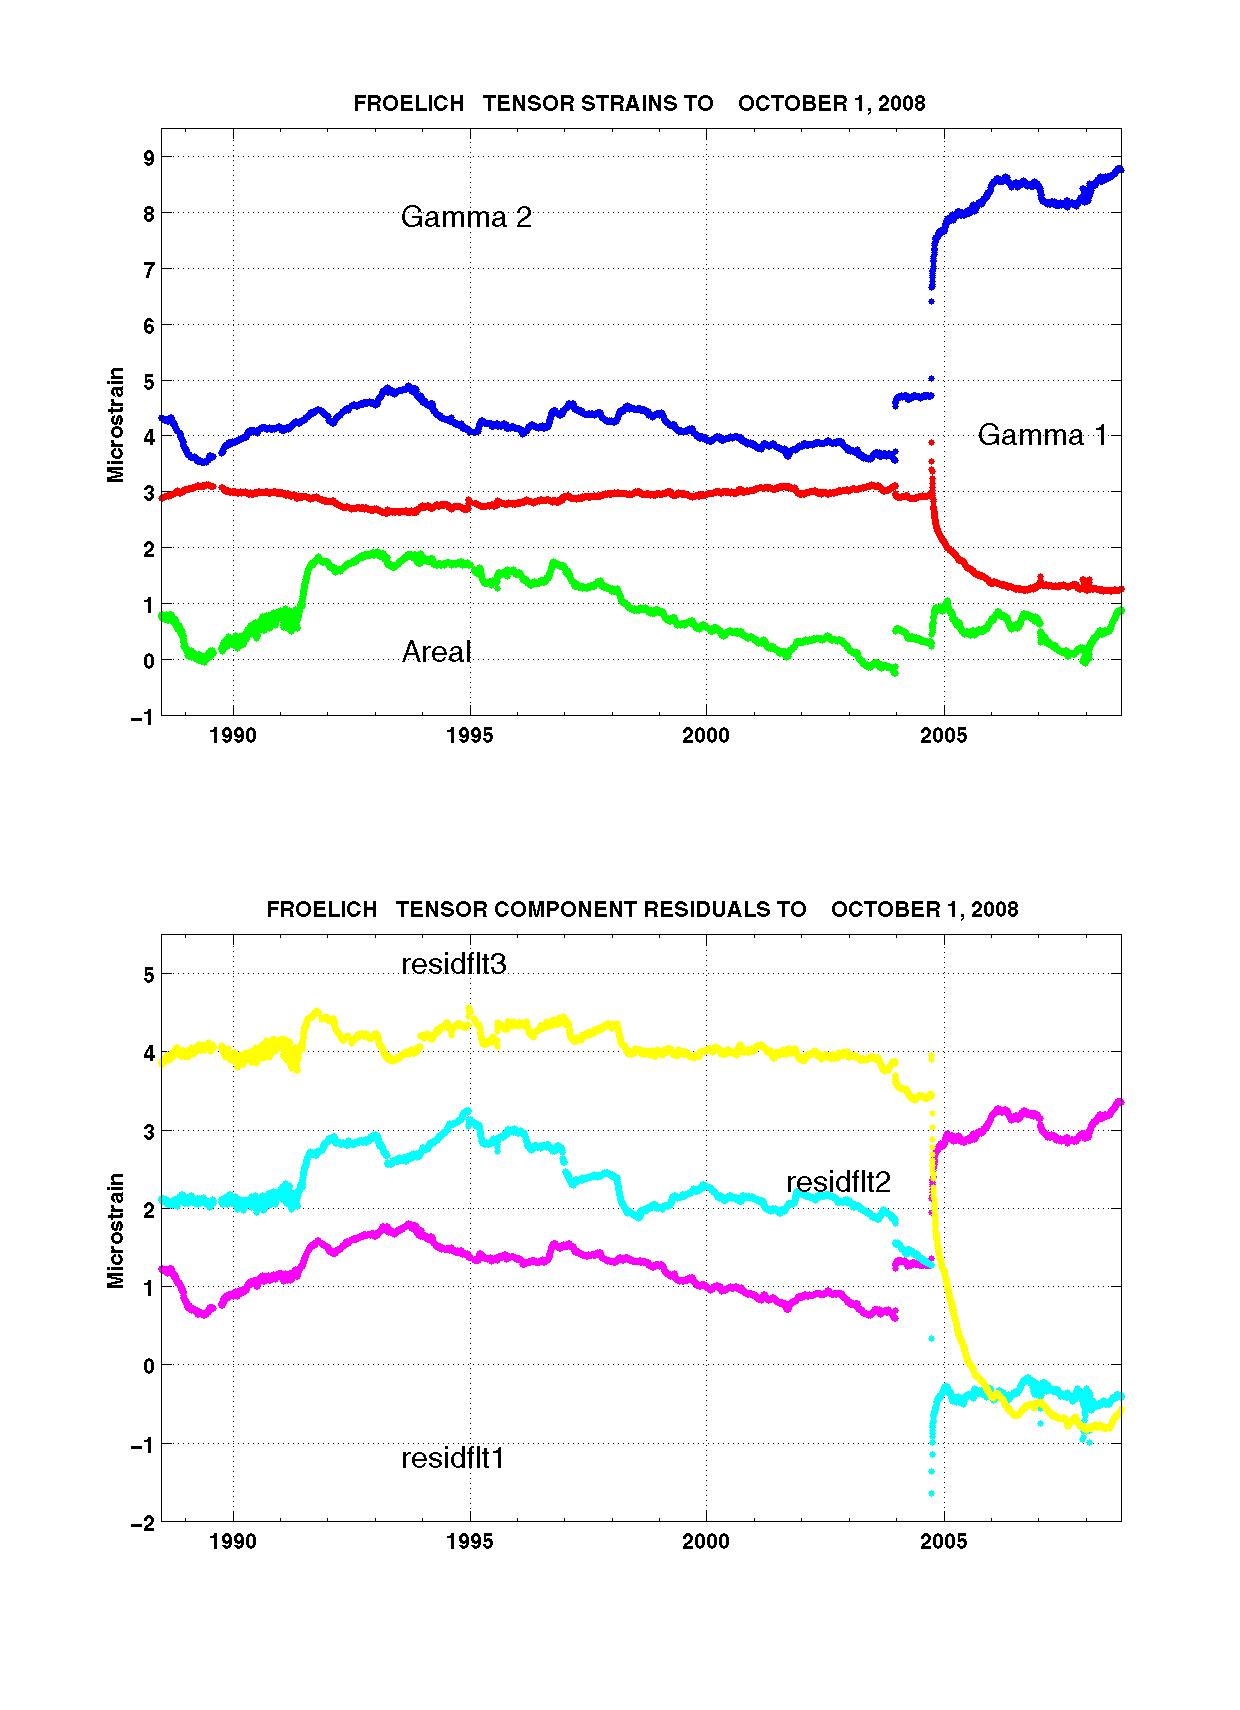
Frohlich - FLT
 Gauge angles
- 1. 39.75 E of N
- 2. 159.75 E of N
- 3. 99.75 E of N
Raw, exponential models, and residual plots for each measured
channel are shown for gauge 1,
gauge 2, and for gauge
3.
Note that the gauge residuals have a Y axis scale range of +/- 4 microstrain
for each component, and show that excluding known tectonic events, all
variation in gauge strain rates have been less than +/- 0.1 microstrain
per year for the whole of the 17 year record,(1986 - )..
The residual linear borehole recovery strain rate over the total record
is shown in microstrain/year as the "slope" on each plot.
Residual data are recovered from the raw data by extracting least squares
fitted exponential(s) and a linear function which describe the processes
of curing of the grout and recovery of the borehole, after drilling and
installation disturbance of the virgin stress field.
Regions used in the least squares fitting are marked in red on the X
axis, and the fit parameters are printed in the upper panelof the
figure and are also tabulated
elsewhere.
In August 2003, the borehole recovery exponentials
were updated from values determined in the early 1990's to incorporate
the additional 10 years of data length now available. Changes of strain
rates calculated from these residuals are unaffected by the exponential
removal procedure and allow the very long term stability(see
gauge 1 , gauge 2, and
gauge 3) of the instruments to be quantified.
.
HISTORY
Raw gauge data for this site shows uphole electronics affected by diurnal
temperature variations.Temperature correction is applied to linearised
gauge data before producing strain data for the final archive.
Since May 2003, a non-tectonic temperature related
artifact is being produced in the data stream from Channel 2, necessitating
sporadic deletion of data initially, up to daily deletions in 2004. Attempts
to rectify this will be made on 2004 field trip.
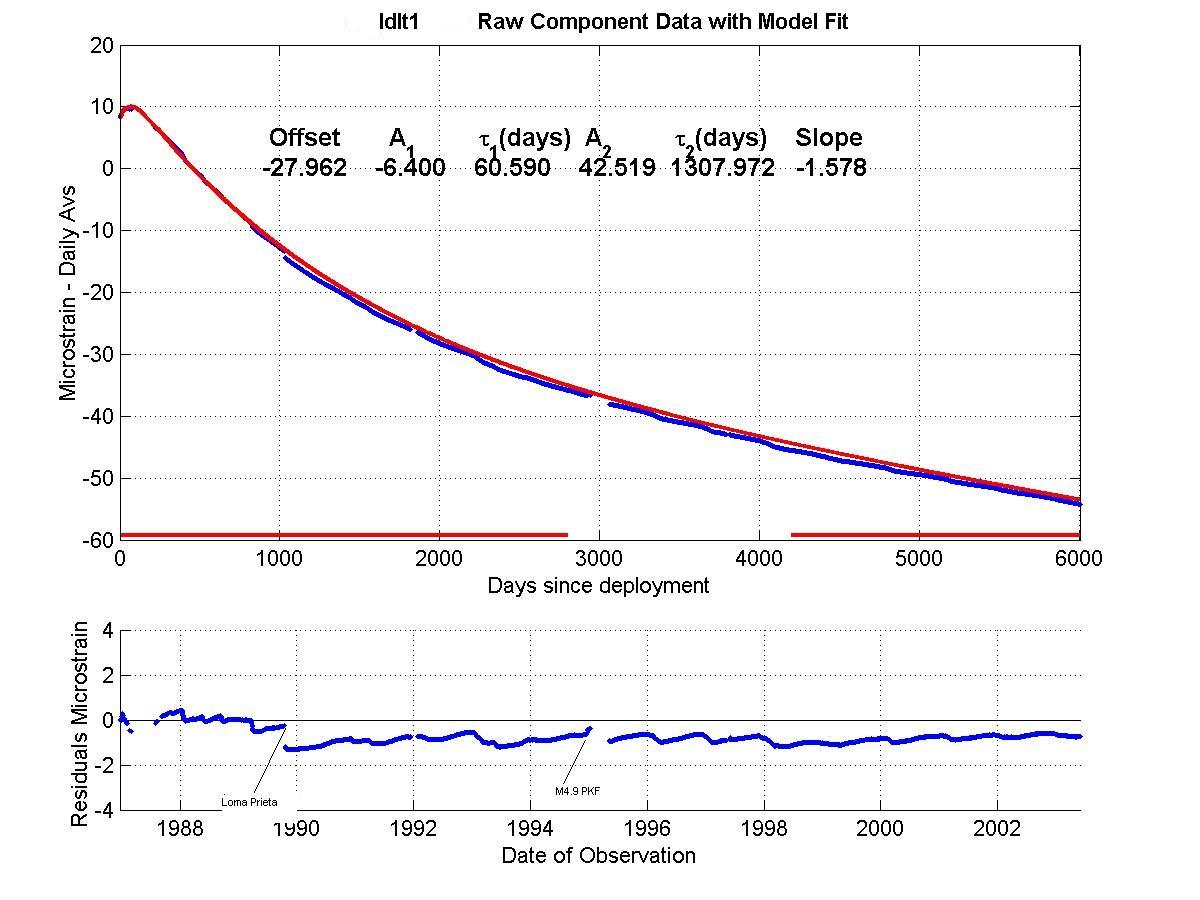
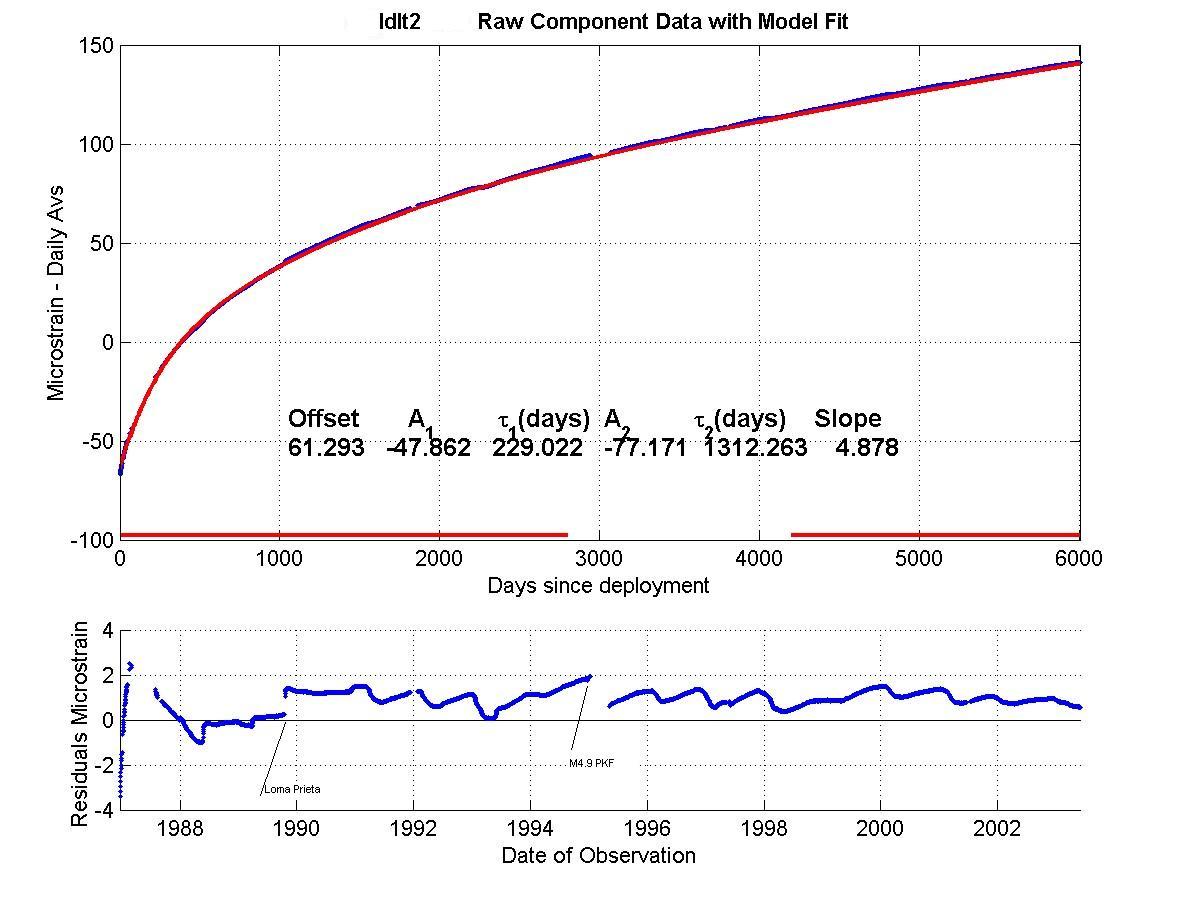
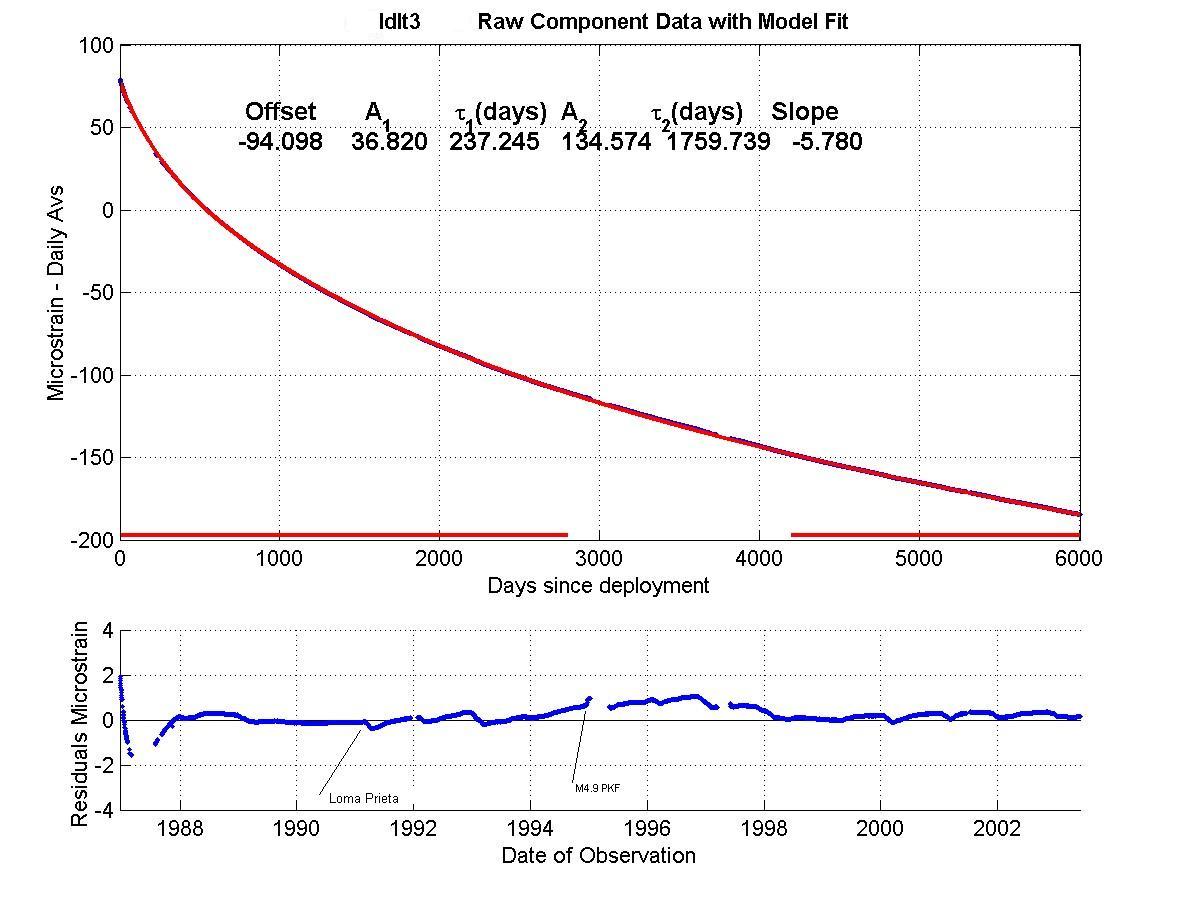
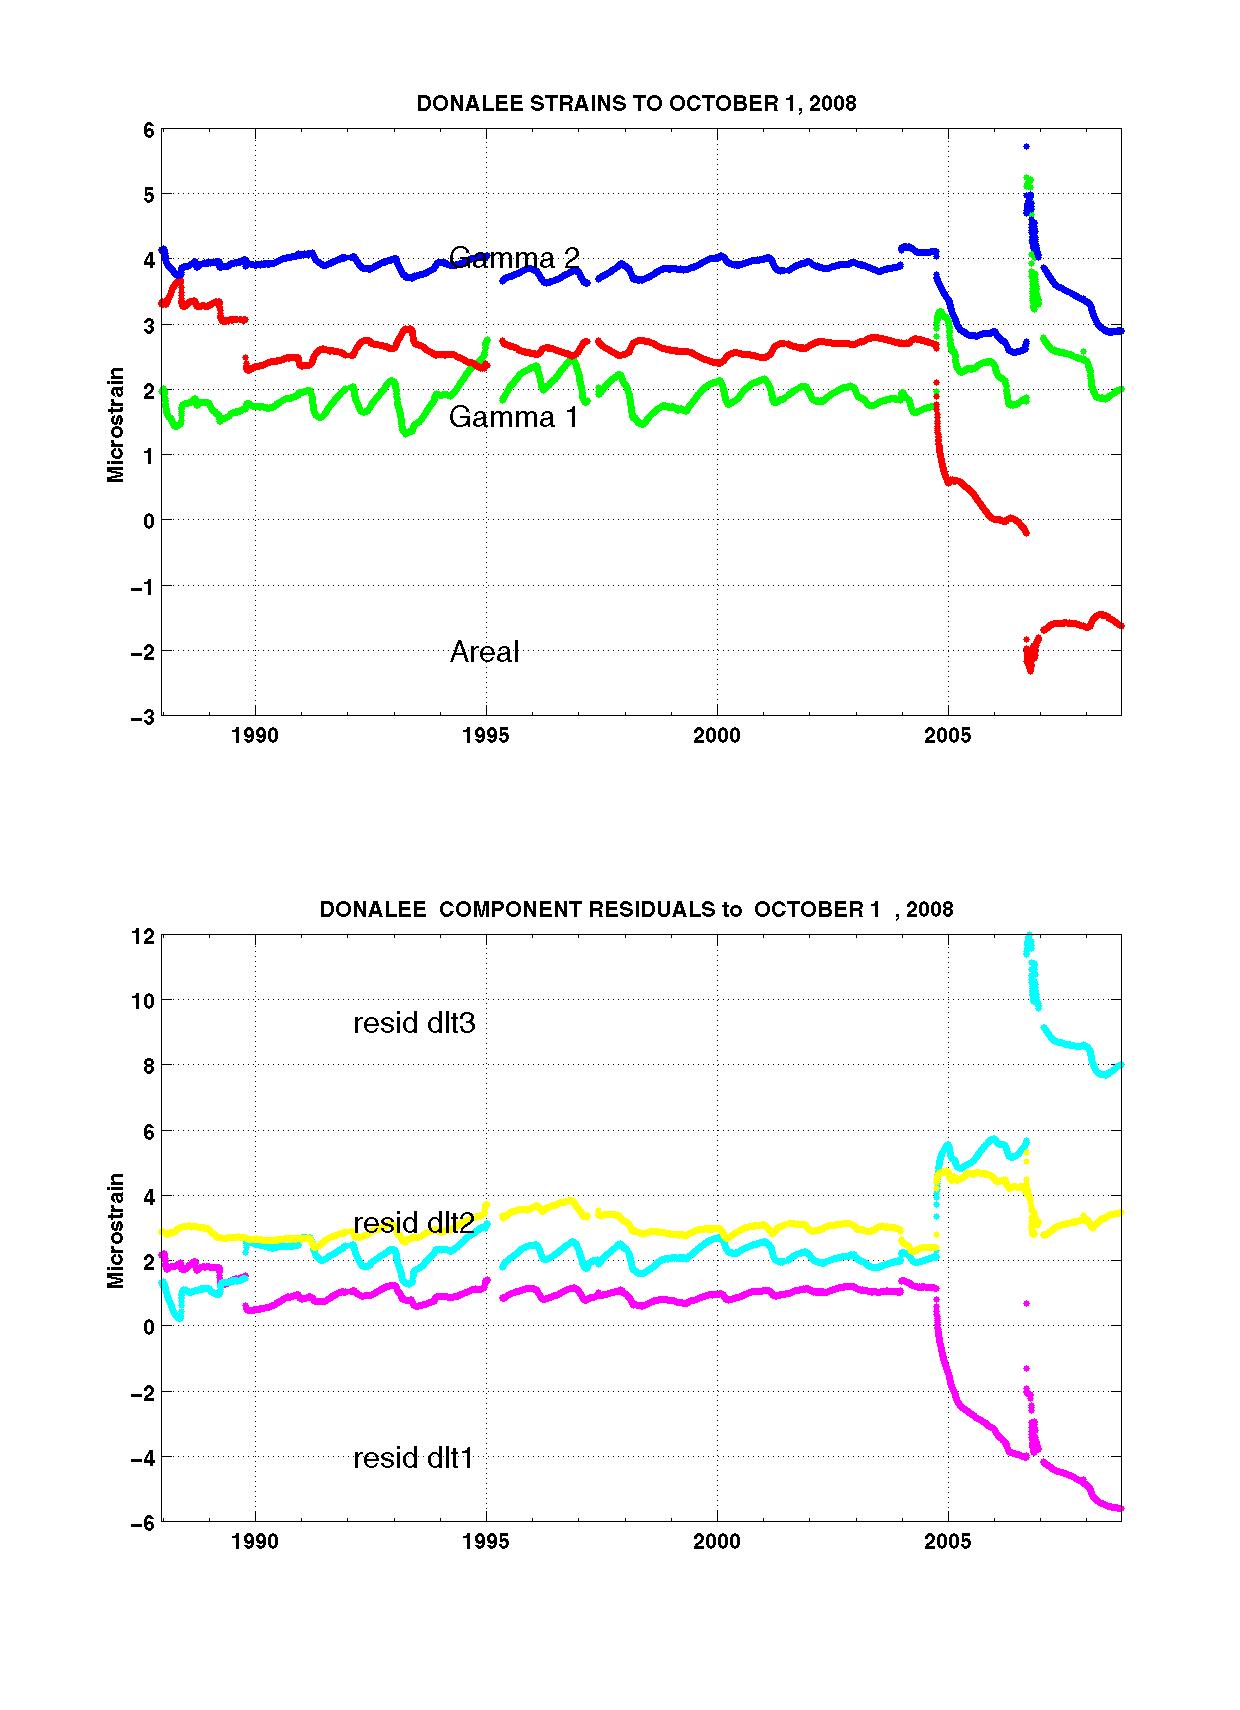
DonaLee - DLT
 Gauge angles
- 1. 71.4 E of N
- 2. 11.4 E of N
- 3. 131.4 E of N
Raw, exponential models, and residual plots for each measured
channel are shown for gauge 1,
gauge 2, and for gauge
3.
Note that the gauge residuals have a Y axis scale range of +/- 4 microstrain
for each component, and show that excluding known tectonic events, all
variation in gauge strain rates have been less than +/- 0.5 microstrain
per year for the whole of the 17 year record,(1986 - )..The variation
in the DLT site is annual and directly related to the presence of an acquifer
which traverses the borehole, and is seen on the other borehole instrument
at this site.
The residual linear borehole recovery strain rate over the total record
is shown in microstrain/year as the "slope" on each plot.
Residual data are recovered from the raw data by extracting least squares
fitted exponential(s) and a linear function which describe the processes
of curing of the grout and recovery of the borehole, after drilling and
installation disturbance of the virgin stress field.
Regions used in the least squares fitting are marked in red on the X
axis, and the fit parameters are printed in the upper panel.of
the figure and are also tabulated
elsewhere.
In August 2003, the borehole recovery exponentials
were updated from values determined in the early 1990's to incorporate
the additional 10 years of data length now available. Changes of strain
rates calculated from these residuals are unaffected by the exponential
removal procedure and allow the very long term stability(see
gauge 1 , gauge 2, and
gauge 3) of the instruments to be quantified.
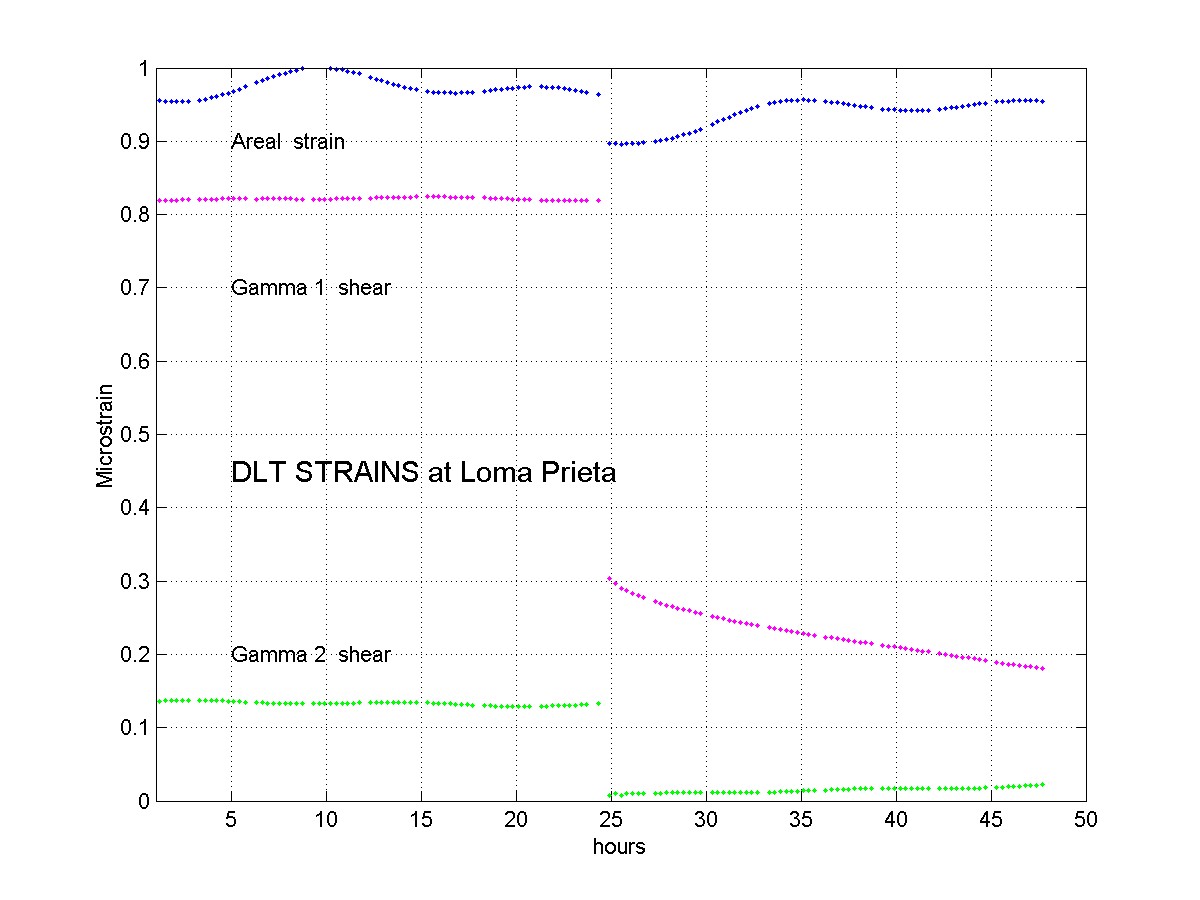
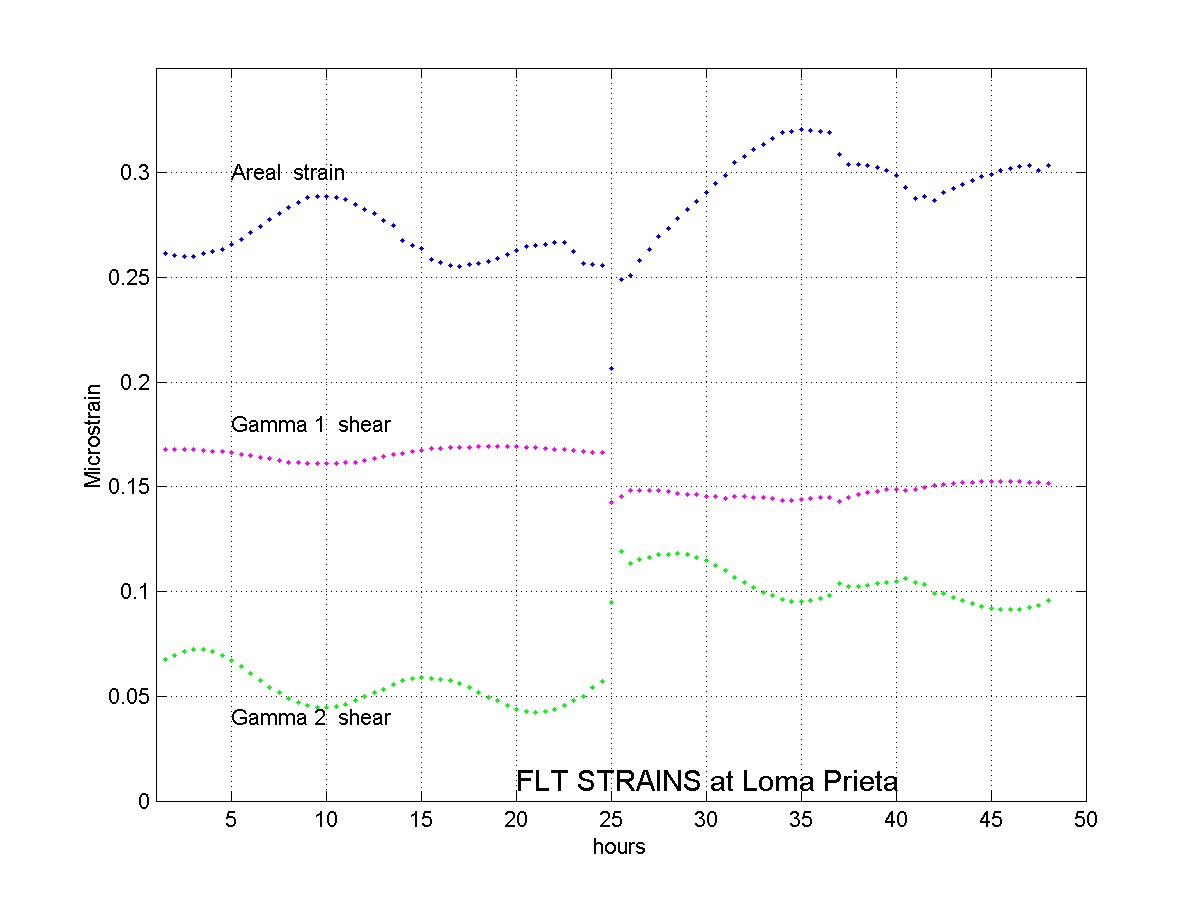
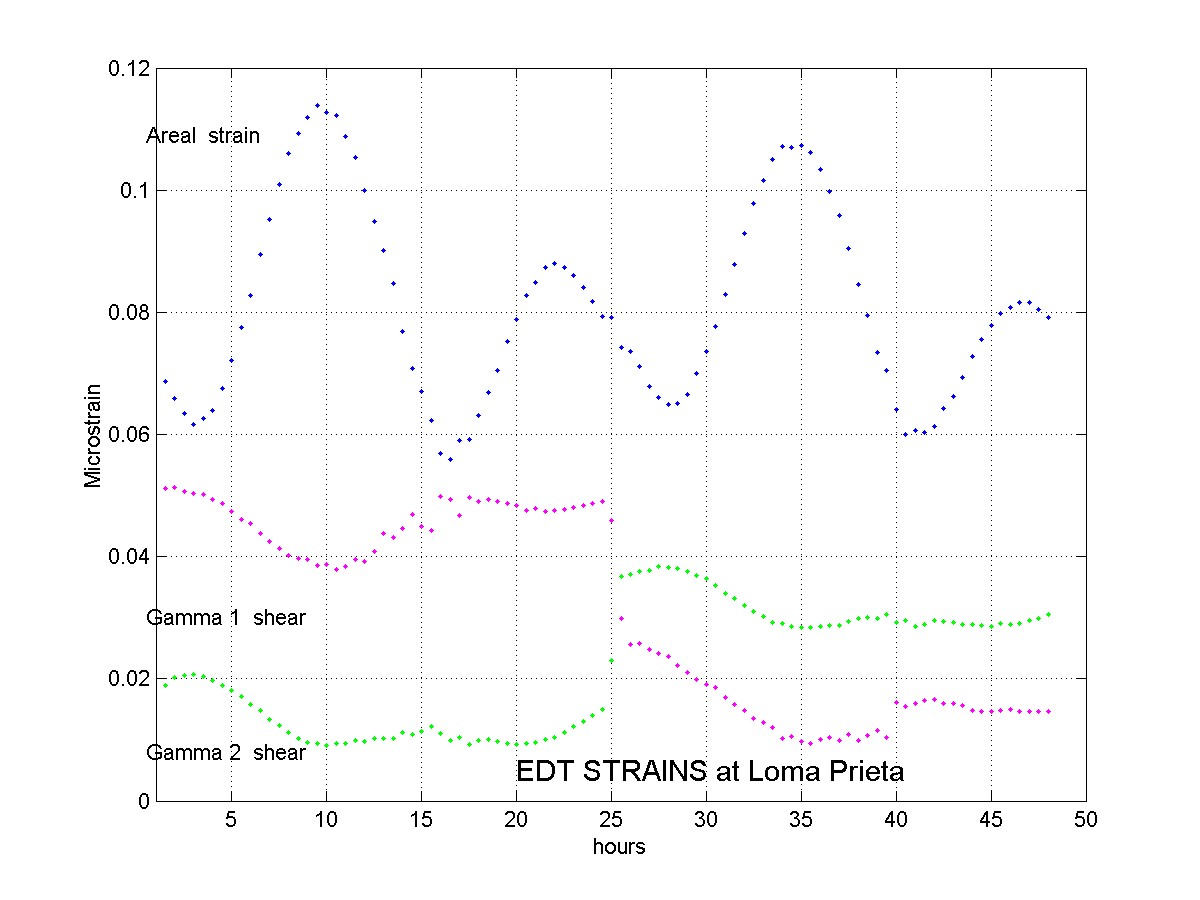
Data plots of interest:
- October 17, 1989 Mag 7.1 Loma Prieta : event
detail plot for DLT; event
detail plot for FLT; and event
detail plot for EDT
-
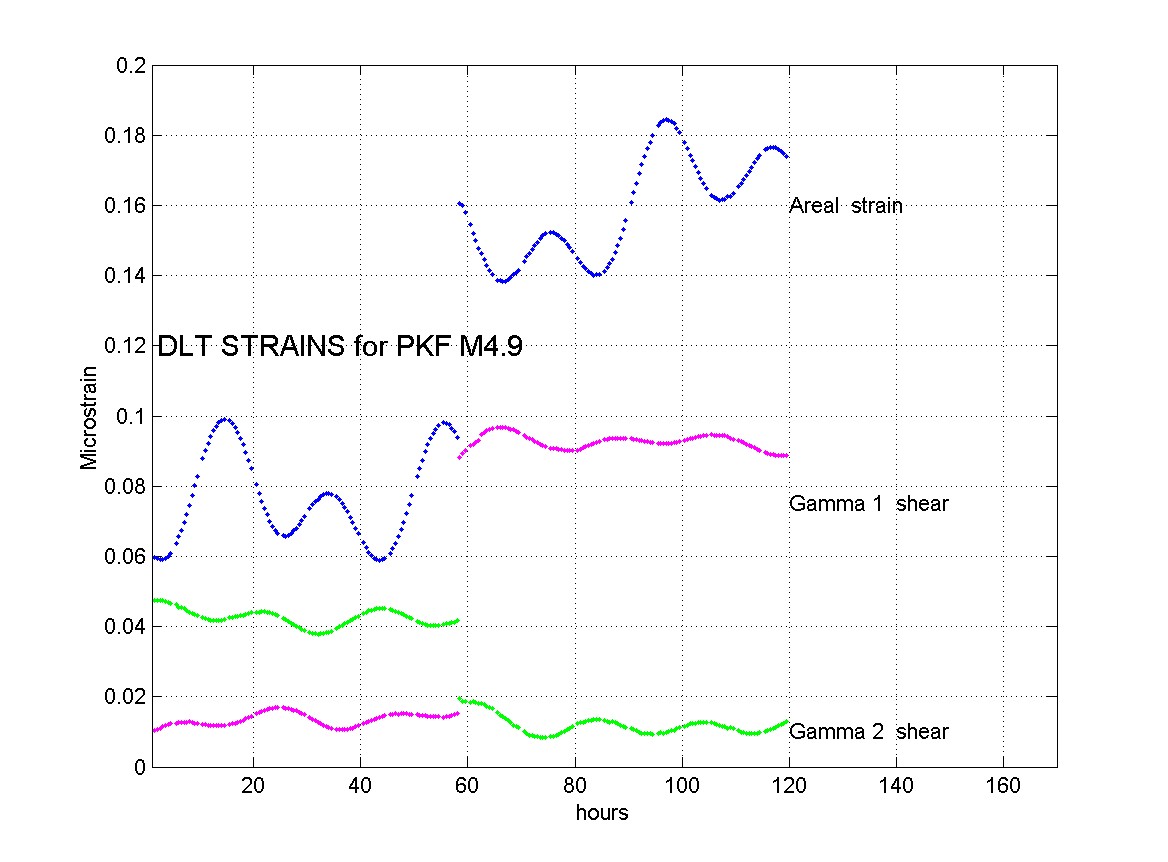
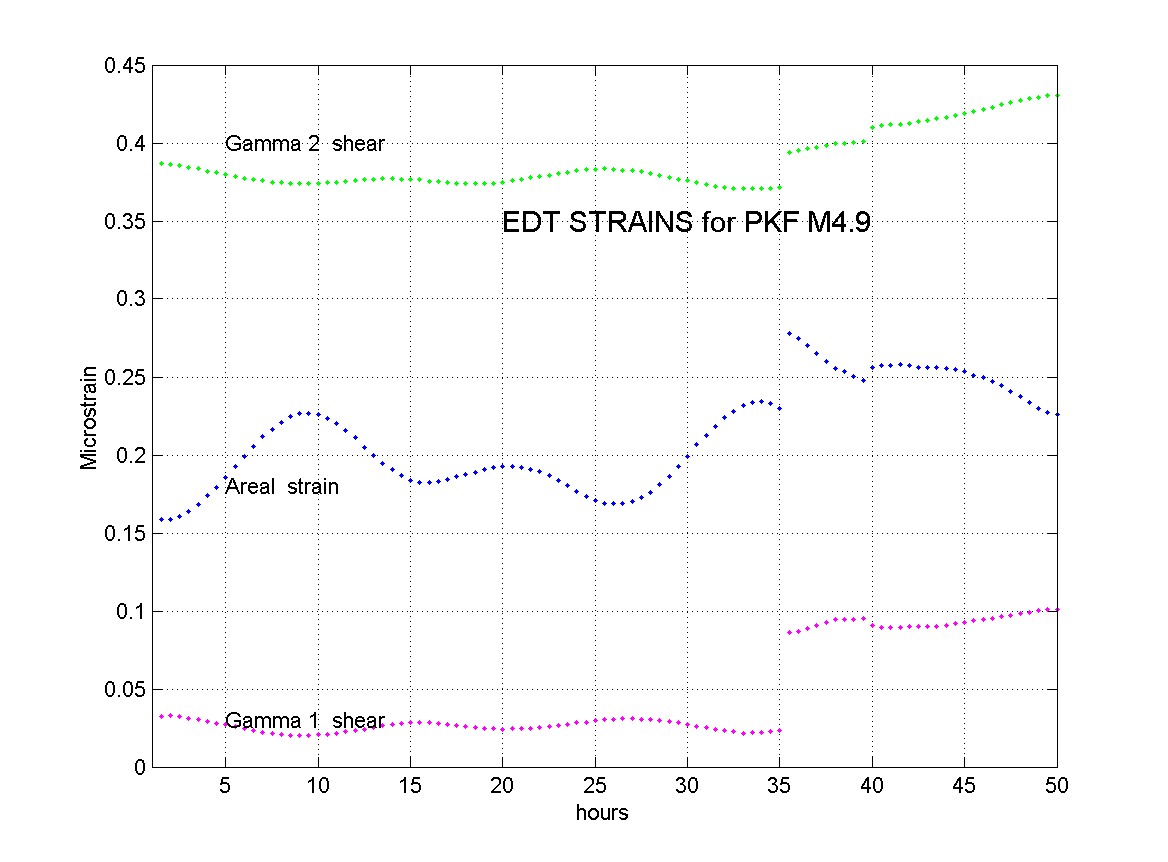
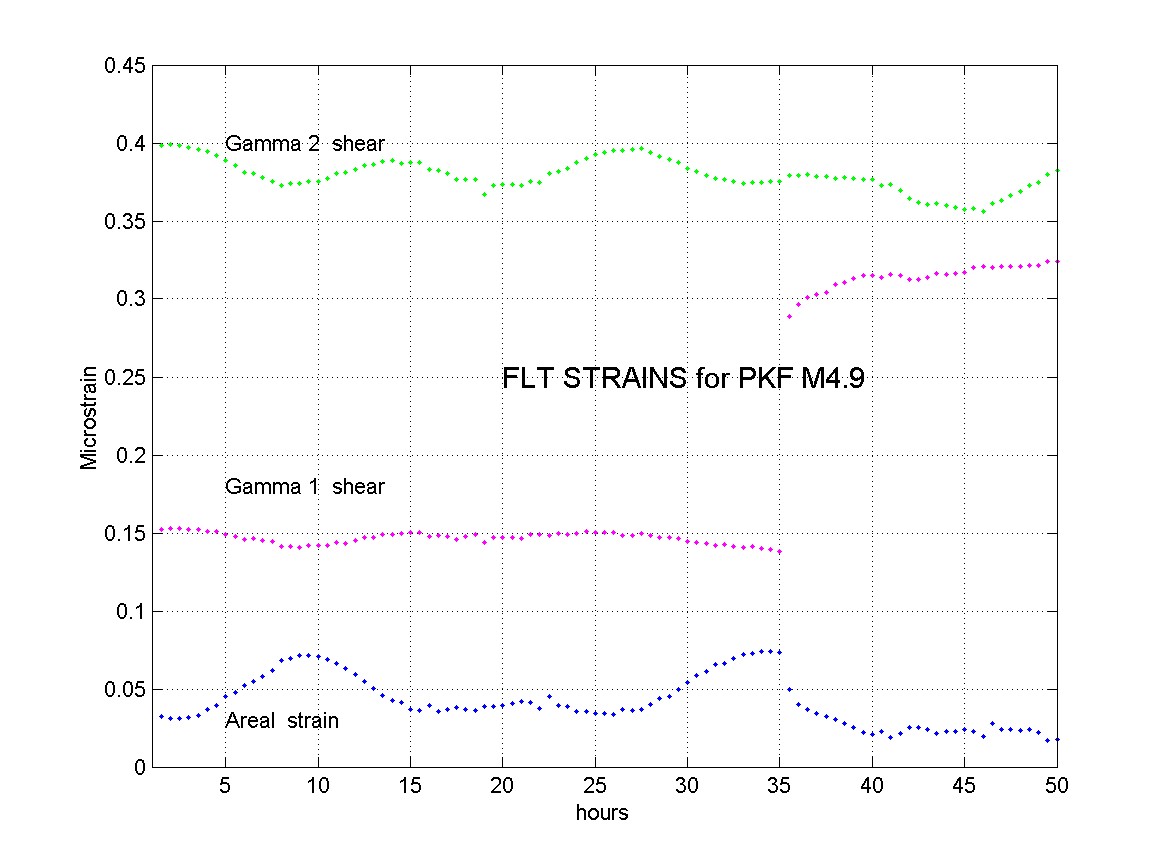
December 1994(/B>Parkfield M4.9 of December 20 ,1994 : short
record detail for DLT : short
record detail for EDT : short
record detail for FLT
-
Parkfield Regional Anomaly 1993-1997: multi-
instrument event detail See papers.
-
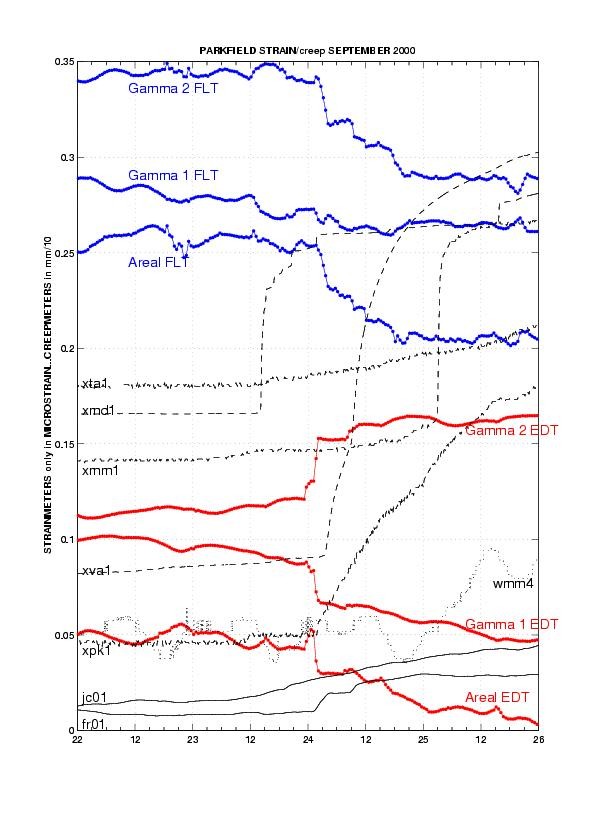
September, 2000 Strain Creep event across the Parkfield array : tensor
strain, dilatometer volumetric strain,creep detail
- Selection of Characteristic Strain/Creep events at FLT: detail
of several events over the years
- Preliminary processing of San Simeon M6.5 as seen
at our GTSM sites at DonnaLee, and Frohlich in Parkfield, and for San
Juan Bautista.
Coseismic steps are approximately:-
DLT
FLT
gam2fl 890ne
The event was also observed at San Juan Bautista:
SJT
-
Parkfield Earthquake of September 28, 2004 as seen
at DLT and FLT in longer term, and depressured,detided, detrended
detail seen , and
postseismic recovery seen
to date May 2005
________________________________________________________
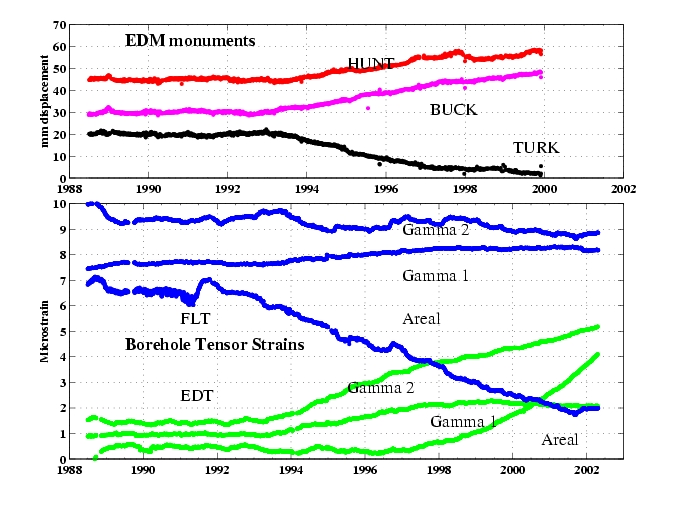
These instruments provide strain data on
- Long term strain accumulation. Data records from the from
the three Parkfield sites EDT,
FLT and DLT
from 1987.
- Medium term strain changes associated with earthquake activity
and other fault processes.
Changes in early September 1998 :long plots: EDT,
FLT and DLT
and short plots: EDT,
FLT and DLT
- Coseismic strain offsets useful for constraining earthquake
source mechanisms,eg see San Simeon 2003, above.
Some other related sites :
|
