|
|
GTSM in SAN FRANCISCO EAST BAY
High precision and high stability measurements
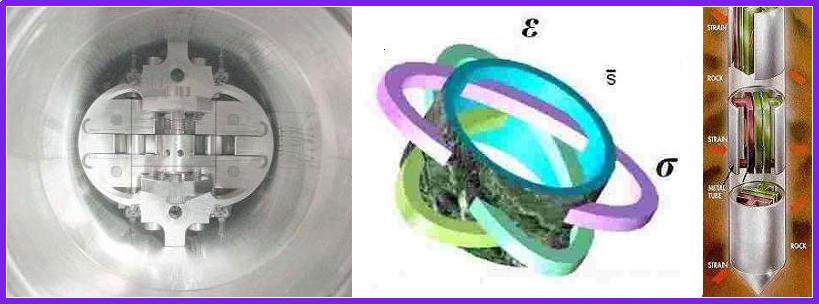
of the horizontal strain field in a region are made in California
using a Gladwin Tensor Strain Measurement instrument (GTSM). These instruments
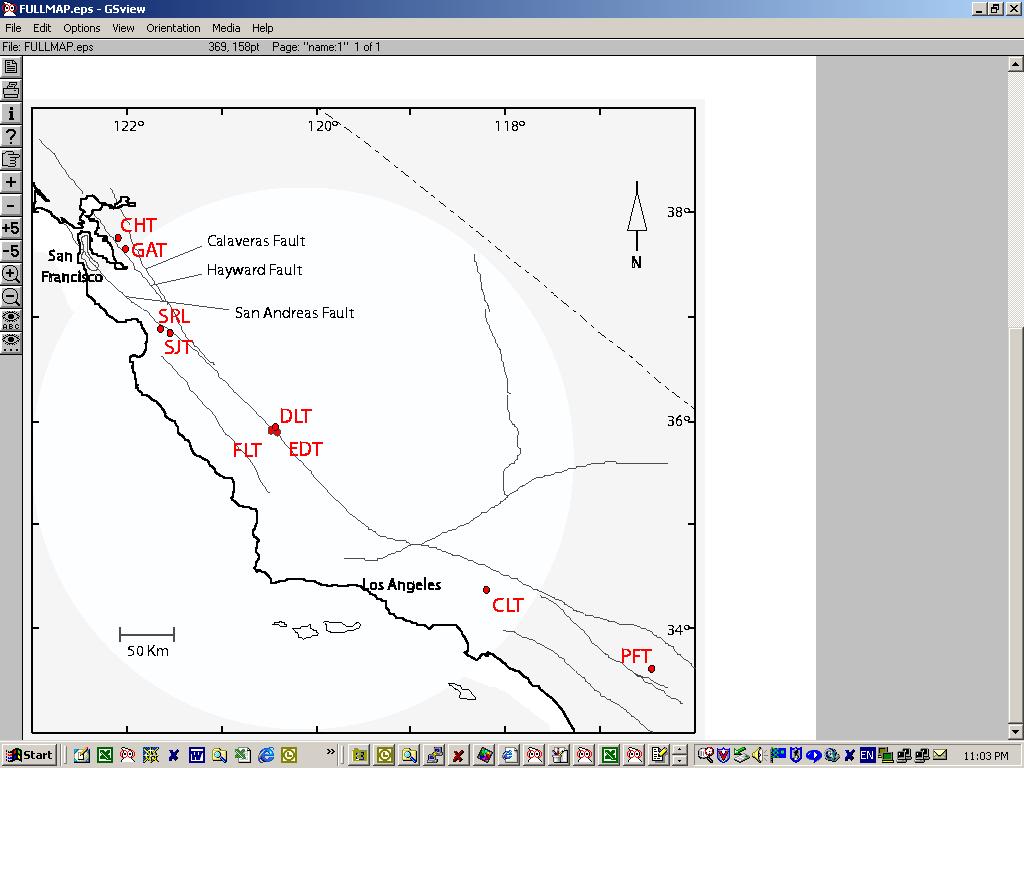
are installed at a depth of 100-200 metres at 8 sites in California. The
sites are shown in red in the accompanying map.
- CHT and GAT are situated in the
East Bay region of San Francisco Bay.
They were installed with co-located Sacks-Evertson dilatometers as
part of a 6 site(Lake Chabot, Garin Park,Coyote, Mill Creek,Sunol,
Russell River) array in September-October 1992. Shortly after
1992, creepmeters [cfw(Fremont-USGS),coz(Oakland Zoo),cpp(Pinole Park),
ctm(Temescal Park), and chp(Palisades)-R.Bilham,U.Colorado] were also
installed.
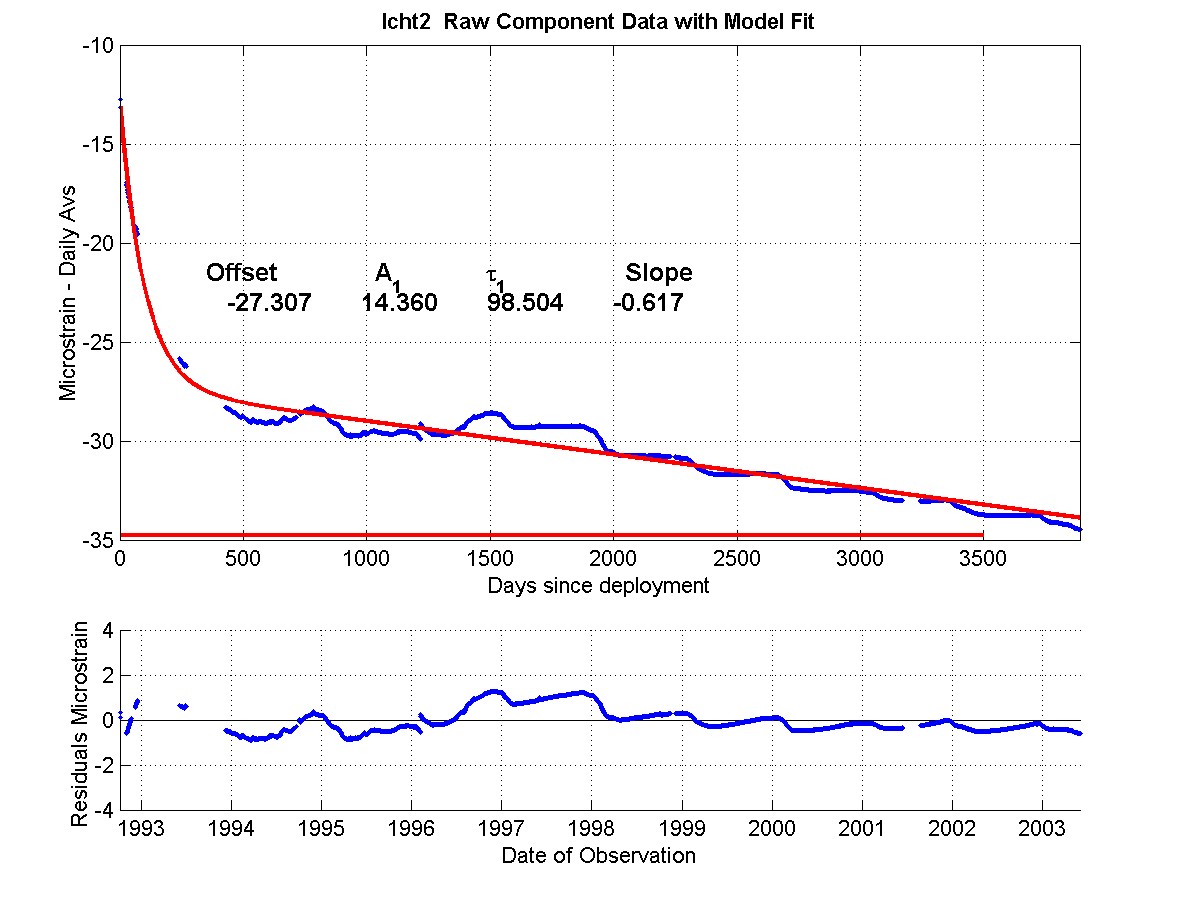
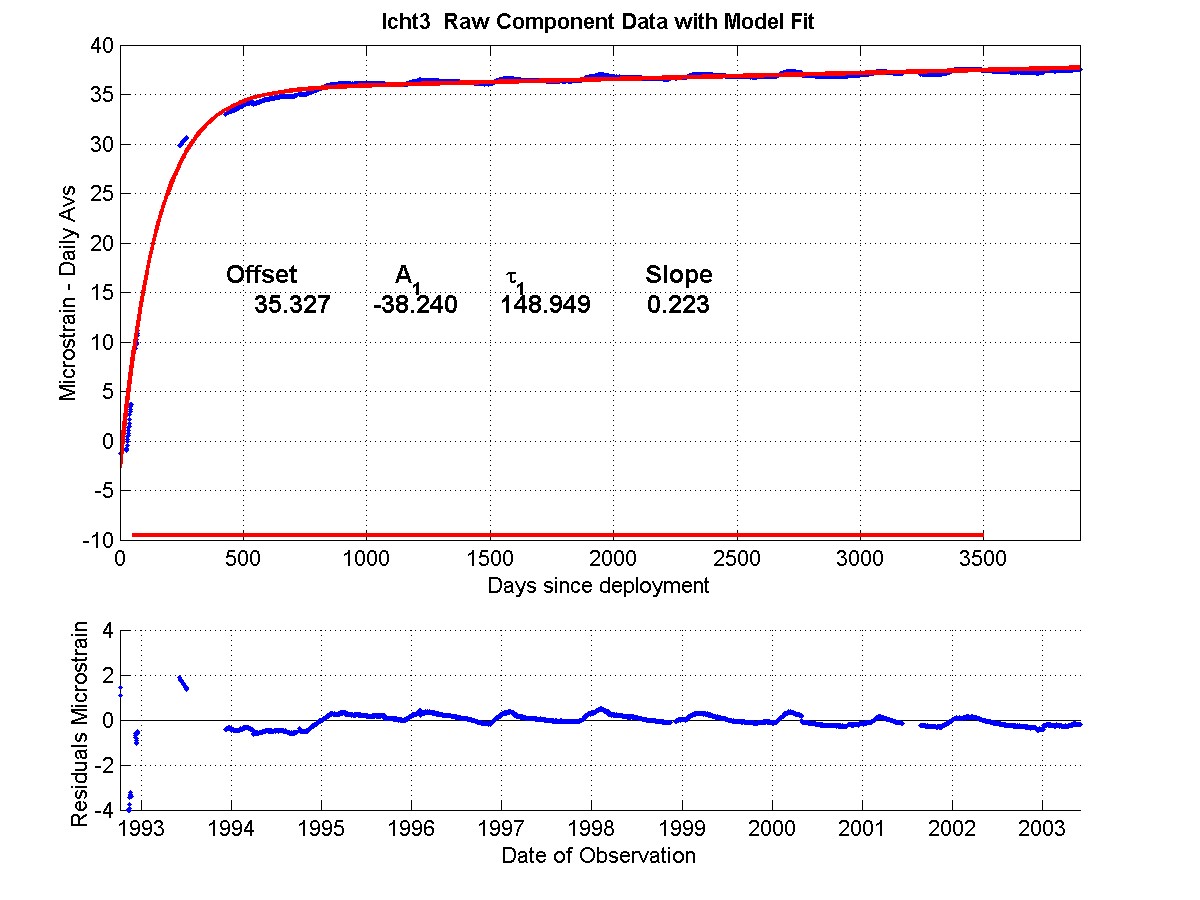
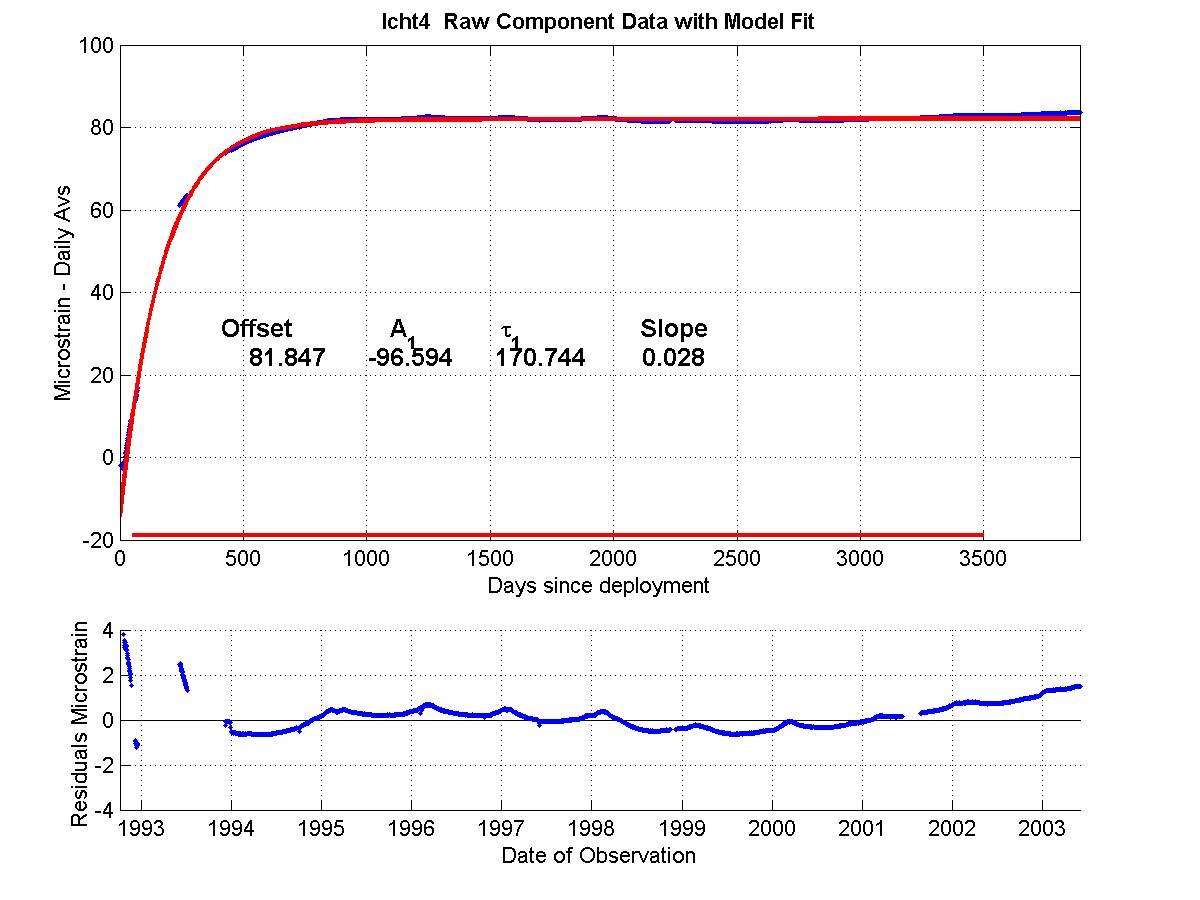
Chabot - CHT
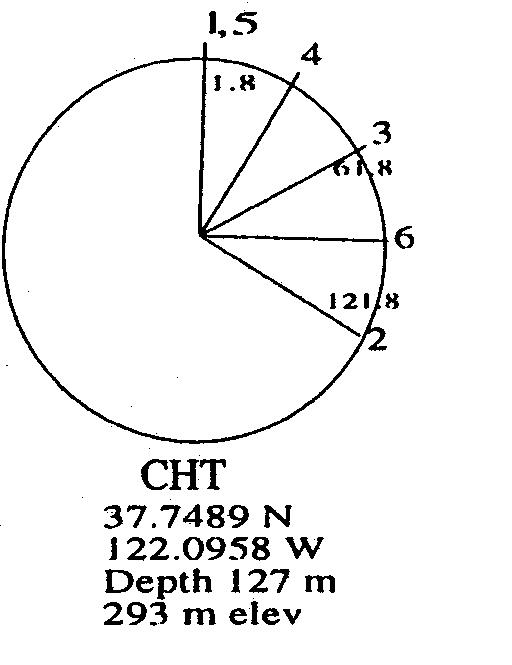
Gauge angles
- 1. 1.8 E of N
- 2. 121.8 E of N
- 3. 61.8 E of N
- 4. 31.8 E of N
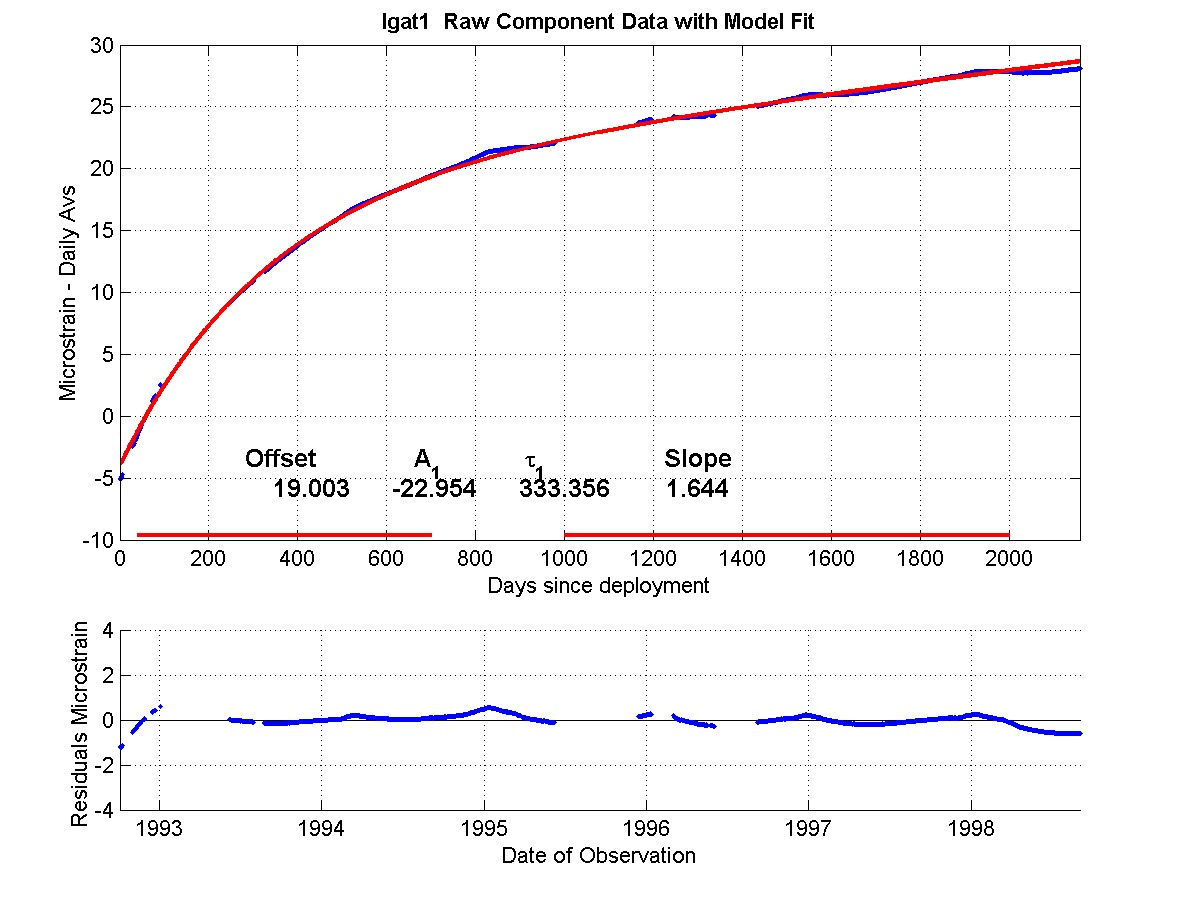
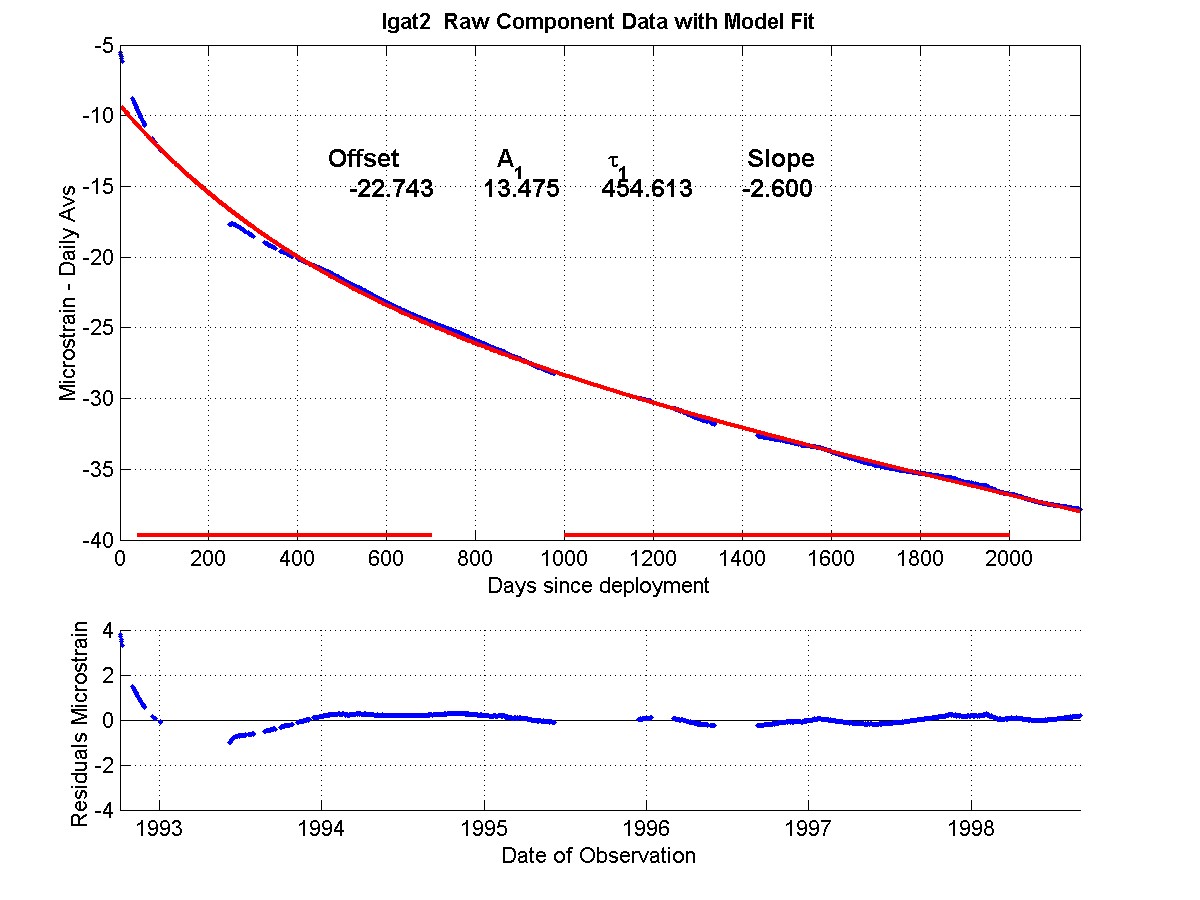
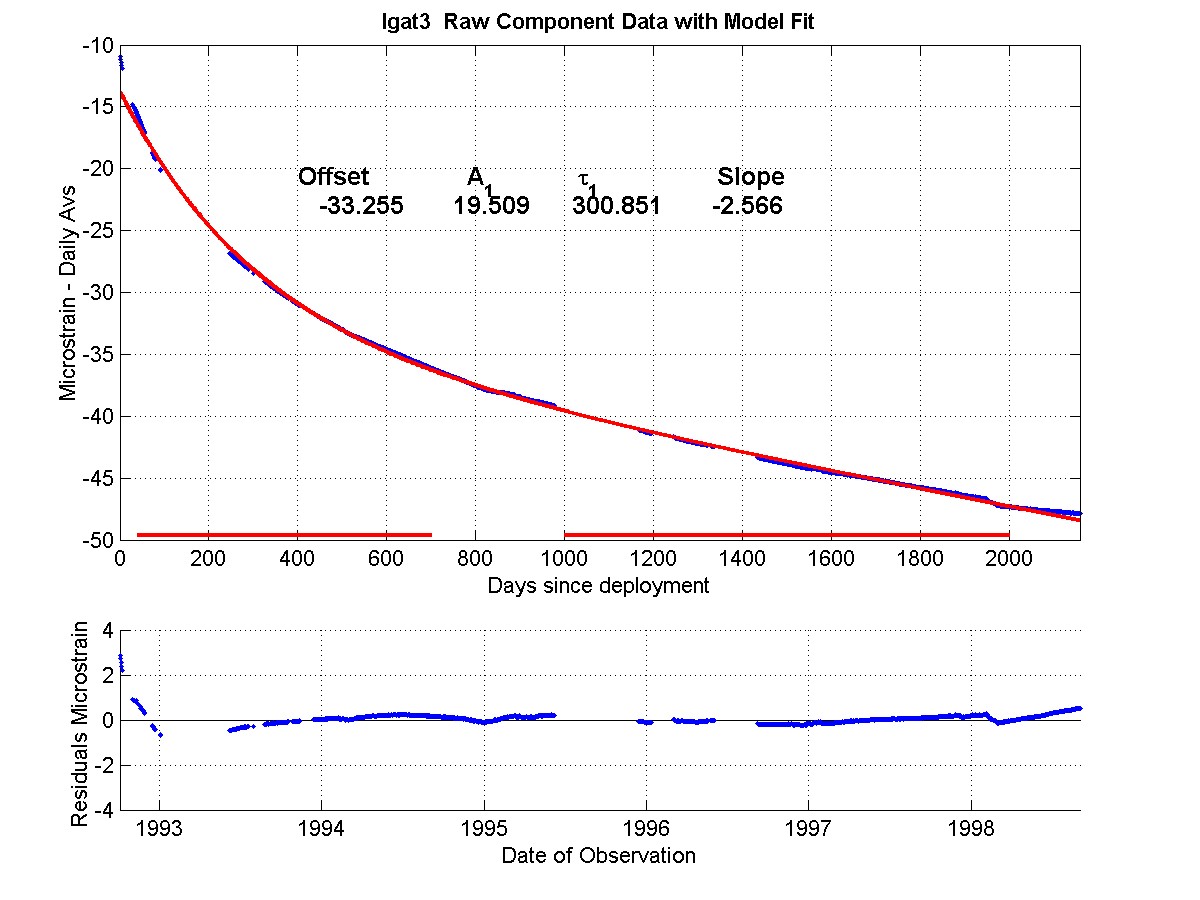
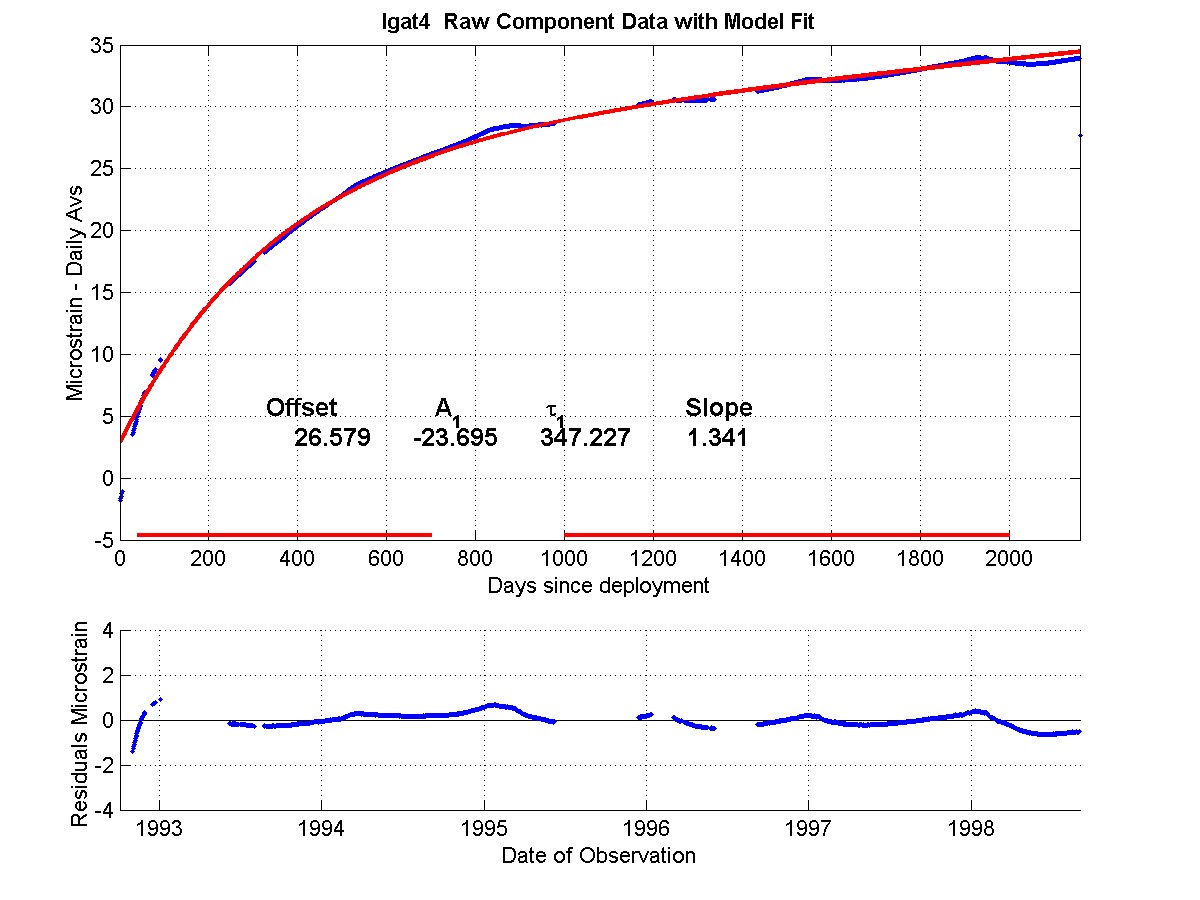
Raw, exponential models, and residual plots for each measured
channel are shown for gauge
2, gauge 3, and for
gauge 4.
Note that the gauge residuals have a Y axis scale range of +/- 4
microstrain for each component, and show that excluding known tectonic
events, all variation in gauge strain rates have been less than
+/- 0.5 microstrain per year for the whole of the 12 year record,(1992
- 2004). The variation in the CHT site is annual and is considered
directly related to the topographic exposure of the site to the varying
water storage in nearby Lake Chabot, and is seen on all these borehole
instruments in this array.
The residual linear borehole recovery strain rate over the total
record is shown in microstrain/year as the "slope" on each plot.
Residual data are recovered from the raw data by extracting least
squares fitted exponential(s) and a linear function which describe
the processes of curing of the grout and recovery of the borehole,
after drilling and installation disturbance of the virgin stress field.
Regions used in the least squares fitting are marked in red on the
X axis, and the fit parameters are printed in the upper panel.of
the figure and are also tabulated
elsewhere.
In August 2003, the borehole recovery exponentials
were updated from values determined in the early 1990's to incorporate
the additional 10 years of data length now available. Changes of
strain rates calculated from these residuals are unaffected by the
exponential removal procedure and allow the very long term stability(see
gauge 2 , gauge 3, and
gauge 4) of the instruments to be quantified.
HISTORY
Data are provided for channels 2, 3, and 4. Anomalous tidal response
was identified on channel 1 early in the life of this instrument. All
post 1986 instruments include a redundant channel (here channel 4) to
be used for this purpose when necessary.
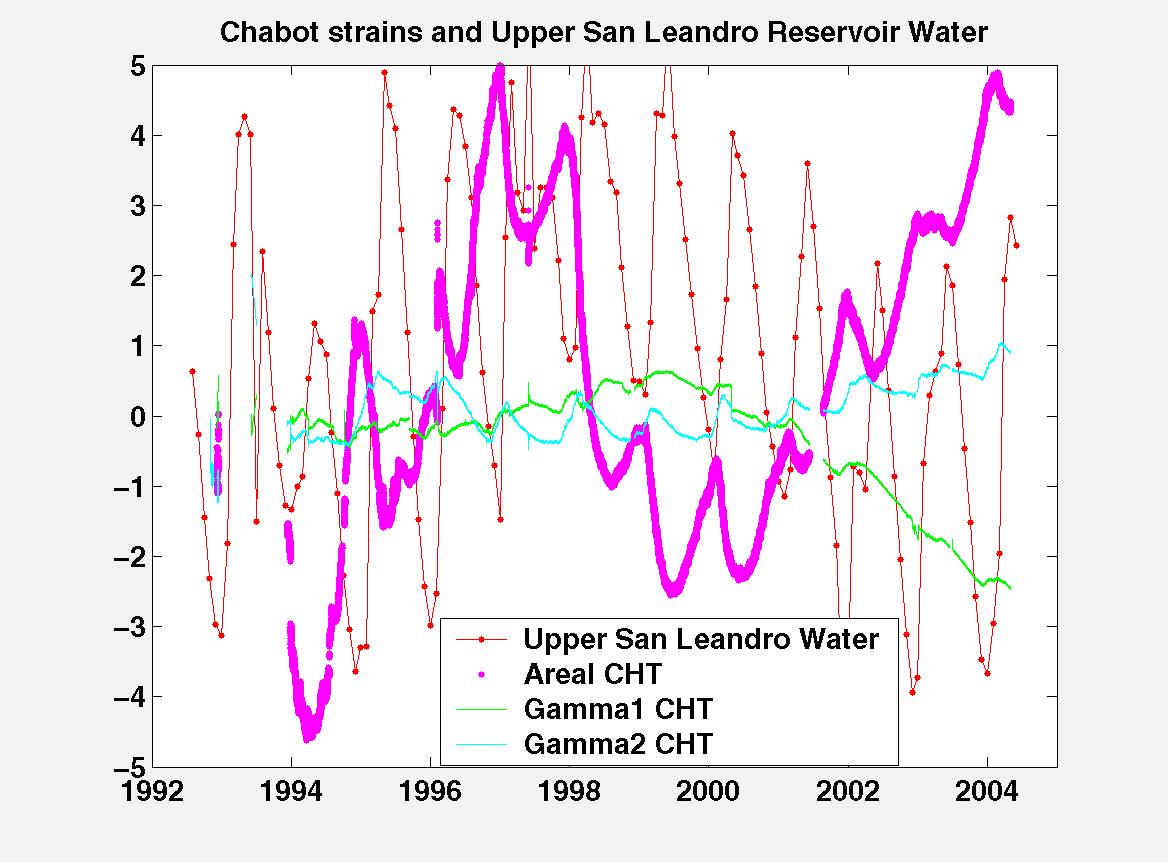
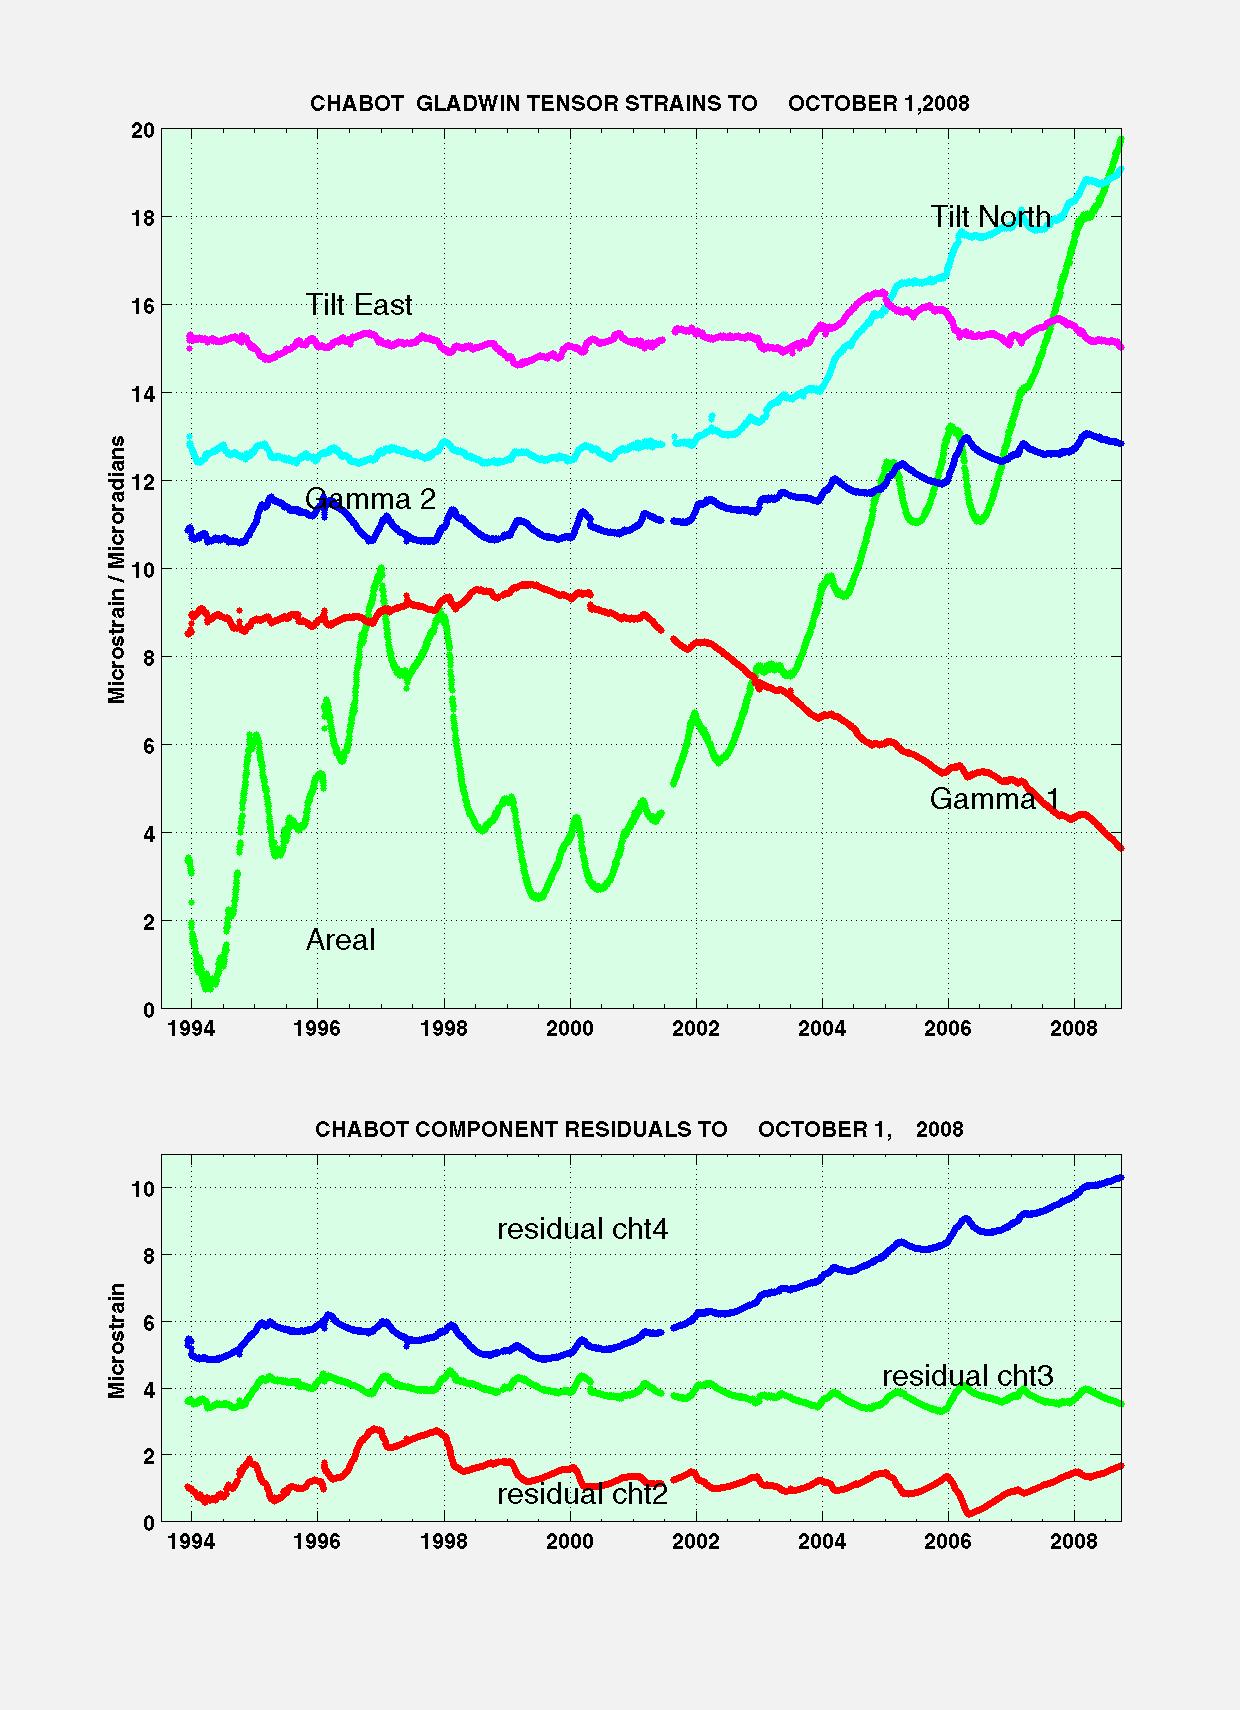
OBSERVED STRAIN and UPPER SAN LEANDRO RESERVOIR
Chabot site (CHT) shows large seasonal strains associated with the water
levels/storage volume in the nearby Upper San Leandro Reservoir. The correlation
is shown, where the direct reservoir
effect is dominantly on the areal strain with minimal perturbation on
the shears. These effects are exacerbated by the strong topography between
the reserve and the site.
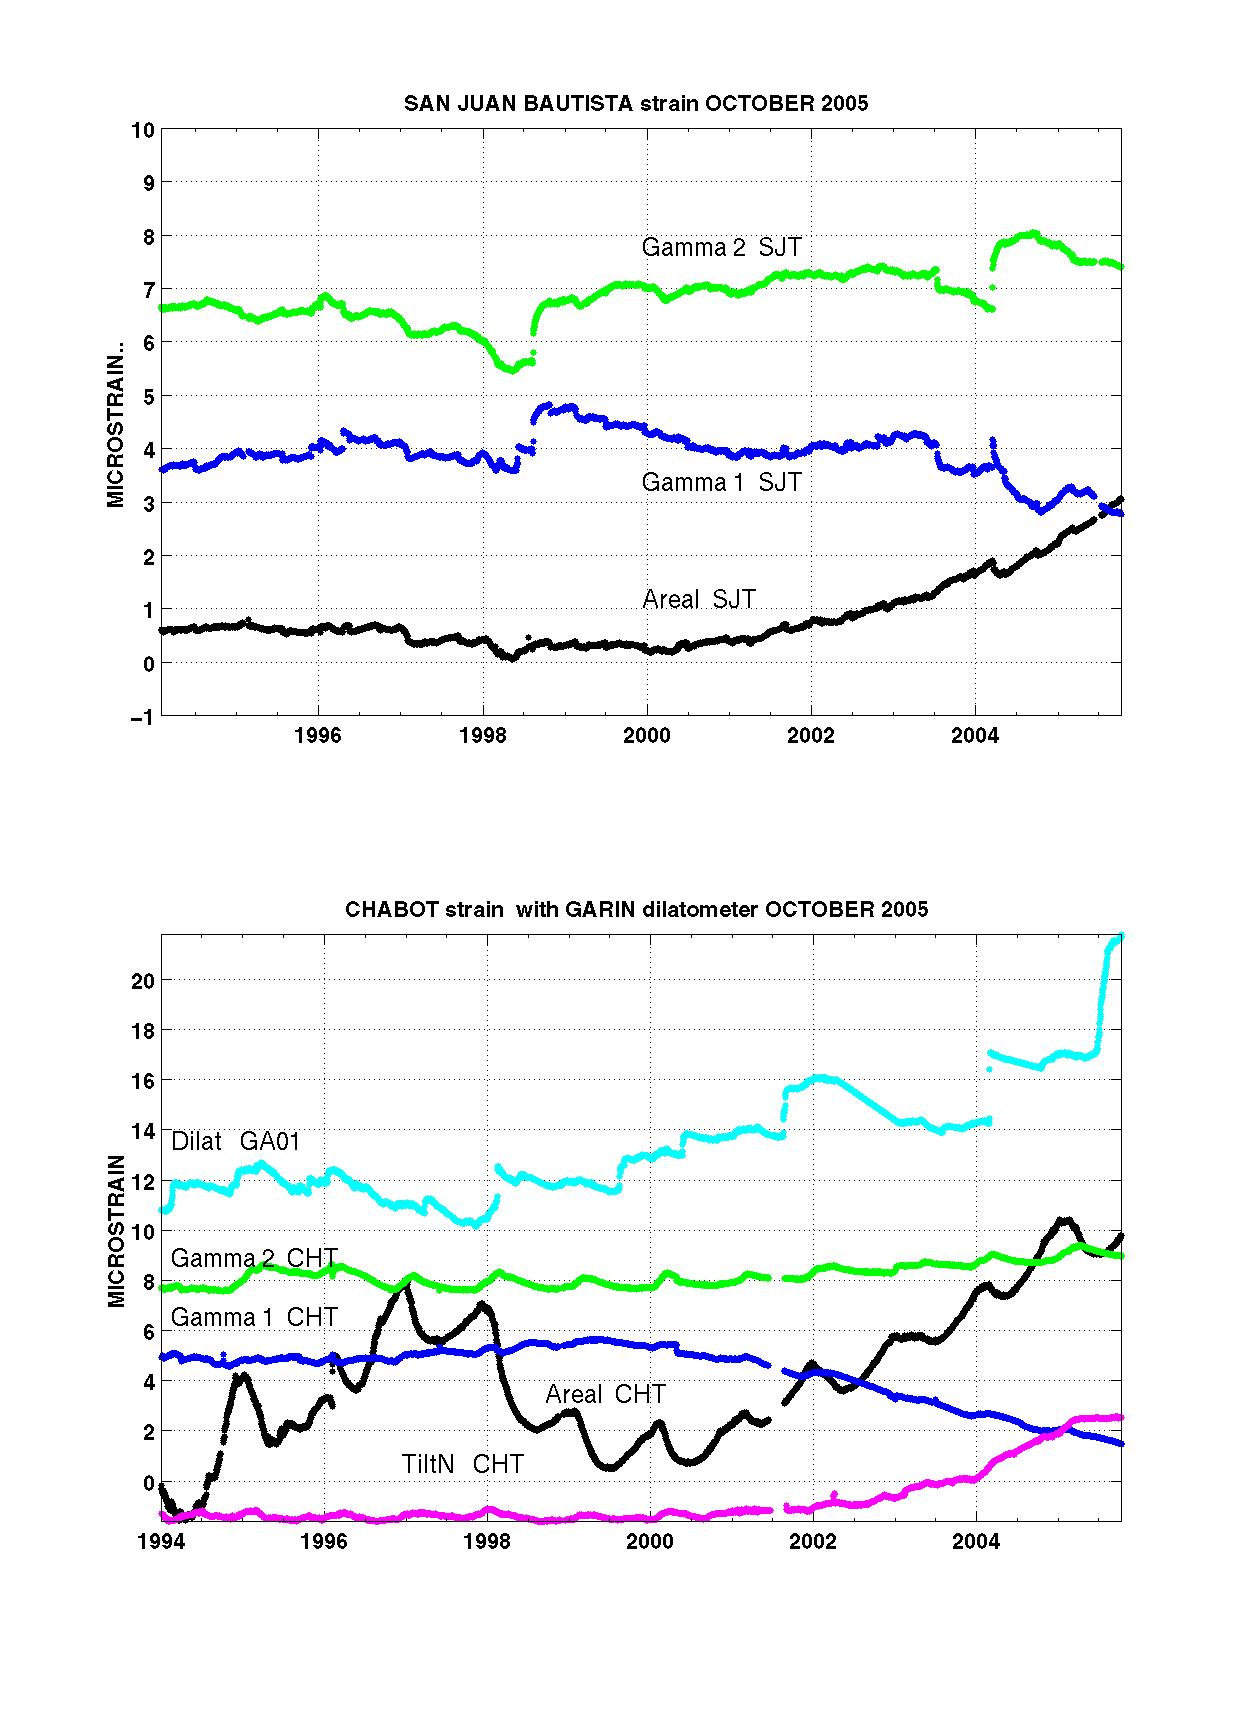
LARGE SCALE OBSERVED STRAIN and TILT
There are accumulating strain rate and tilt rate changes which began in 2000
and continued since then). This change of strain rate appears to be over an extensive
area.
Data for the 11 year period ending October 2005 for the two stations SJT and CHT and
the Sacks-Evertson dilatometer at Garin (cyan trace). These sites are far apart and
totally independent, yet the time signatures and amplitude scaling of the anomalous
responses in areal strain at SJT in the Monterey Bay area and Gamma1 strain at CHT are remarkably similar.
If it continues, it represents an anomaly at a spatial scale not previously identified
in this project. The change in strain rate is approximately 0.6 microstrain
per year at SJT and nearly 1 microstrain per year in Gamma1 at CHT, and should
be detectable in GPS data for the time period. The effect is confirmed at CHT by
the independent tilt channel NS. At both sites the changes are almost undisturbed
by the SJT slowquake of March 2004 or the Parkfield event in September,2004.
The component data from all the miniPBO sites in San Francisco Bay area have also been
residualised and examined for trend changes. However, all of these sites are under
4 years since installation, and corroborative signals would not be expected to be
seen, especially as the changes seen in the East bay sites CHT and GAT began just
before the miniPBO installation.
GARIN - GAT
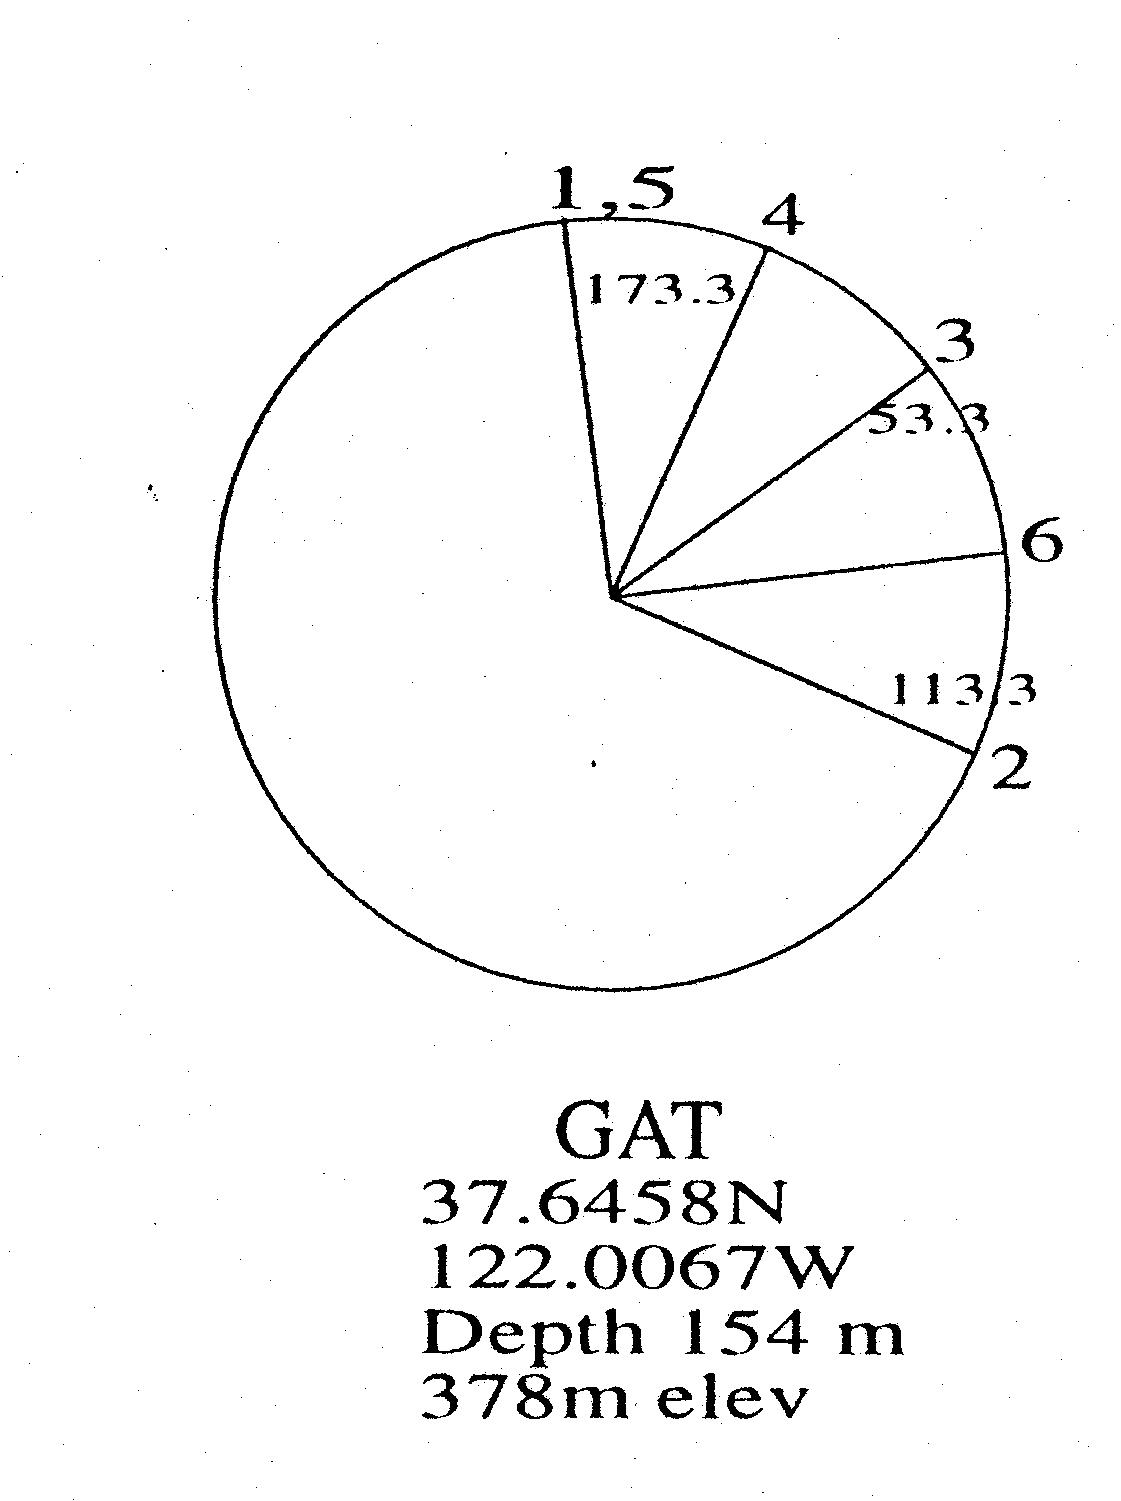
Gauge angles
- 1. 173.3 E of N
- 2. 113.3 E of N
- 3. 53.3 E of N
- 4. 23.3 E of N
Raw, exponential models, and residual plots for each measured
channel are shown for gauge 1,
gauge 2, gauge
3, and for gauge 4.
Note that the gauge residuals have a Y axis scale range of +/- 4 microstrain
for each component, and show that excluding known tectonic events, all
variation in gauge strain rates have been less than +/- 0.1 microstrain
per year for the whole of the 6 year record,(1992 - 1998).
The residual linear borehole recovery strain rate over the total record
is shown in microstrain/year as the "slope" on each plot.
Residual data are recovered from the raw data by extracting least squares
fitted exponential(s) and a linear function which describe the processes
of curing of the grout and recovery of the borehole, after drilling and
installation disturbance of the virgin stress field.
Regions used in the least squares fitting are marked in red on the X
axis, and the fit parameters are printed in the upper panelof the
figure and are also tabulated elsewhere.
In August 2003, the borehole recovery exponentials
were updated from values determined in the early 1990's to incorporate
the additional years of data length now available. Changes of strain
rates calculated from these residuals are unaffected by the exponential
removal procedure and allow the very long term stability(see
gauge 1 , gauge 2,
gauge 3,and gauge 4) of the
instruments to be quantified.
.
HISTORY
During deployment of this instrument, the deployment cable was damaged
approximately 30 meters from the surface by failure of a manually controlled
guide pulley. A field repair was undertaken because only one target horizon
was available below the casing. By May 6, 1994, fluid leakage into the
cable was detected. Several attempts were made over the years to 1998
to control copper conductor corrosion, but in September 1998, complete
failure of several conductors resulted in loss of downhole contact. This
is one of only two GTSM instruments on grid power, and the long sections
of missing data initially, were due to delays in connection to the grid,
and temporary availability of solar power.
This station was taken off-line on September 2 1998.
These instruments provide strain data on
- Long term strain accumulation. Data records are available from
the East Bay sites near the Hayward fault, GAT
and CHT from 1993. Tilt records are
also available from the Gladwin Tensor instrument at GAT
and CHT from 1993.
- Medium term strain changes associated with earthquake activity
and other fault processes.
- Coseismic strain offsets useful for constraining earthquake
source mechanisms.
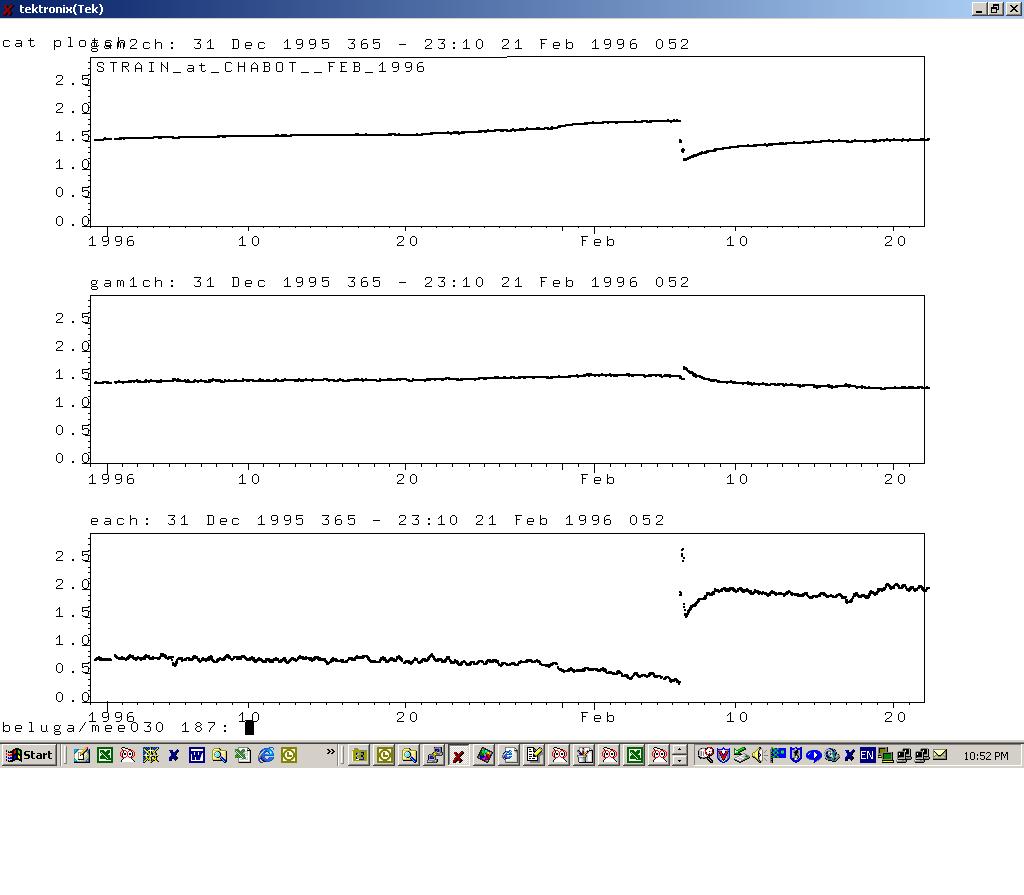
Data plots of interest in East Bay:
- Feb 1996 Strain : event
detail plot
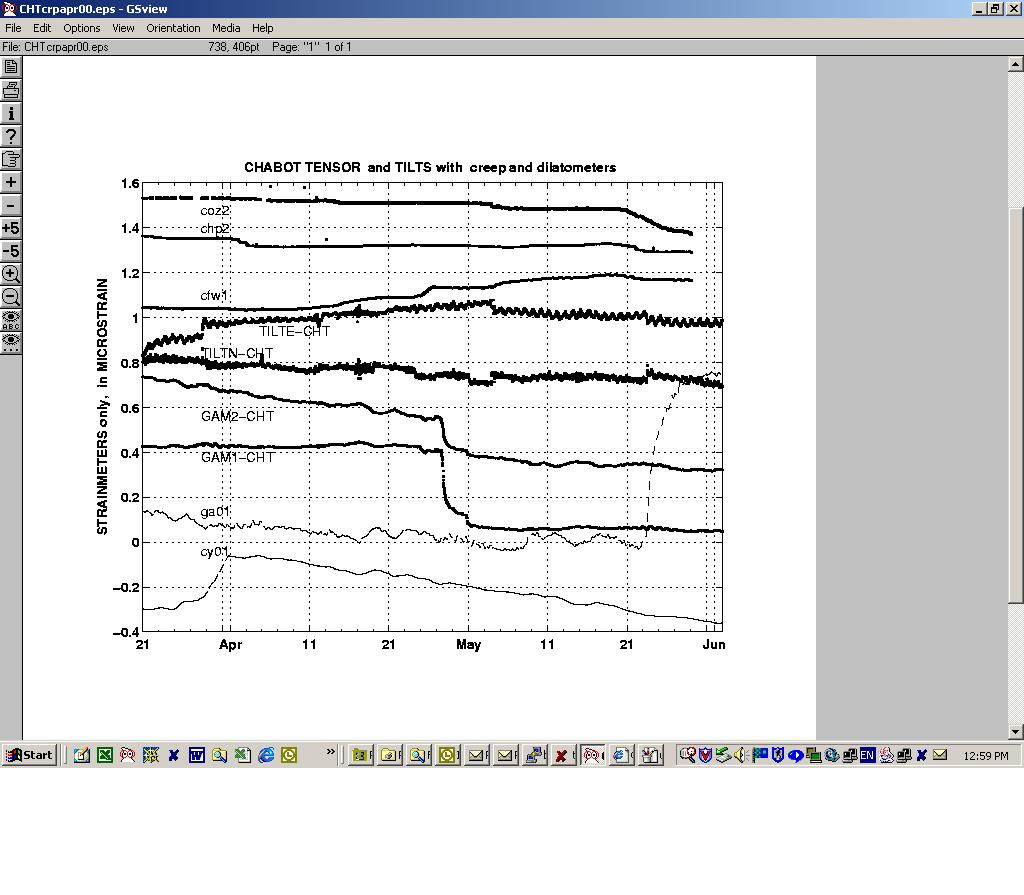
- April 27, 2000 Strain Tilt Creep: event
detail plot with tilt measured on the GTSM on-board tiltmeter.
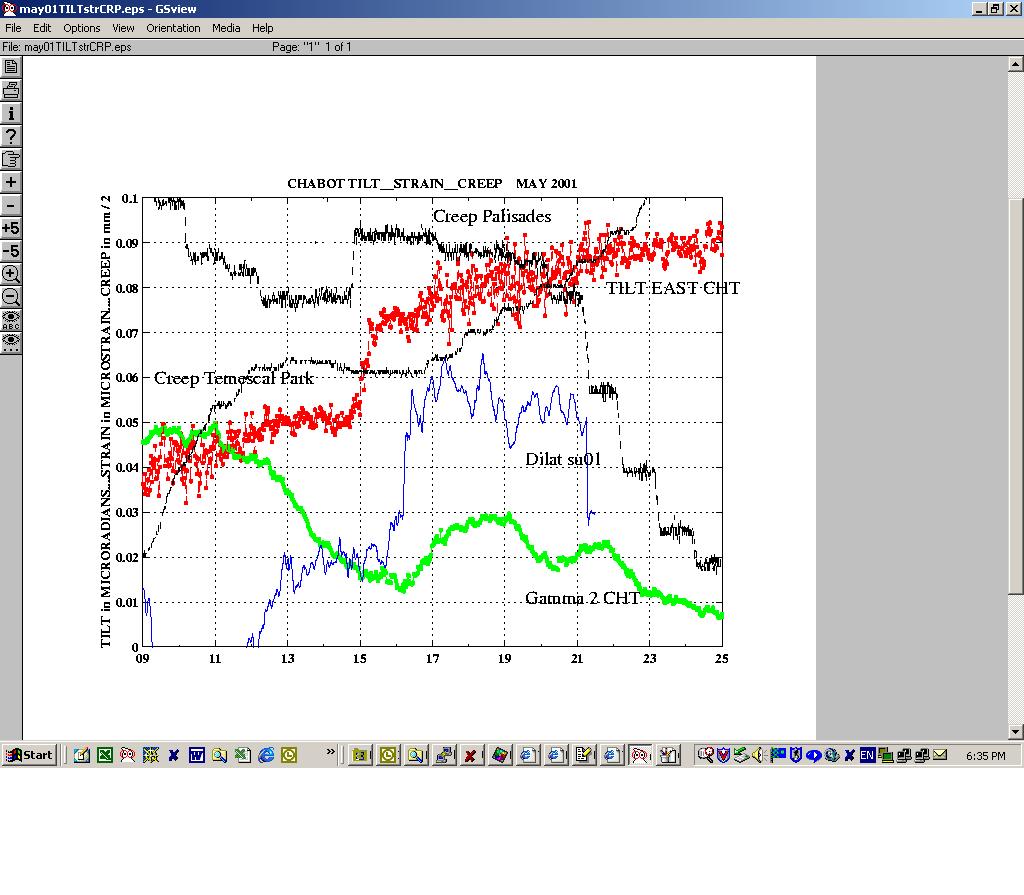
- May 11 - 17, 2001 Strain Tilt Creep: event
detail plot with tilt measured on the GTSM on-board tiltmeter.
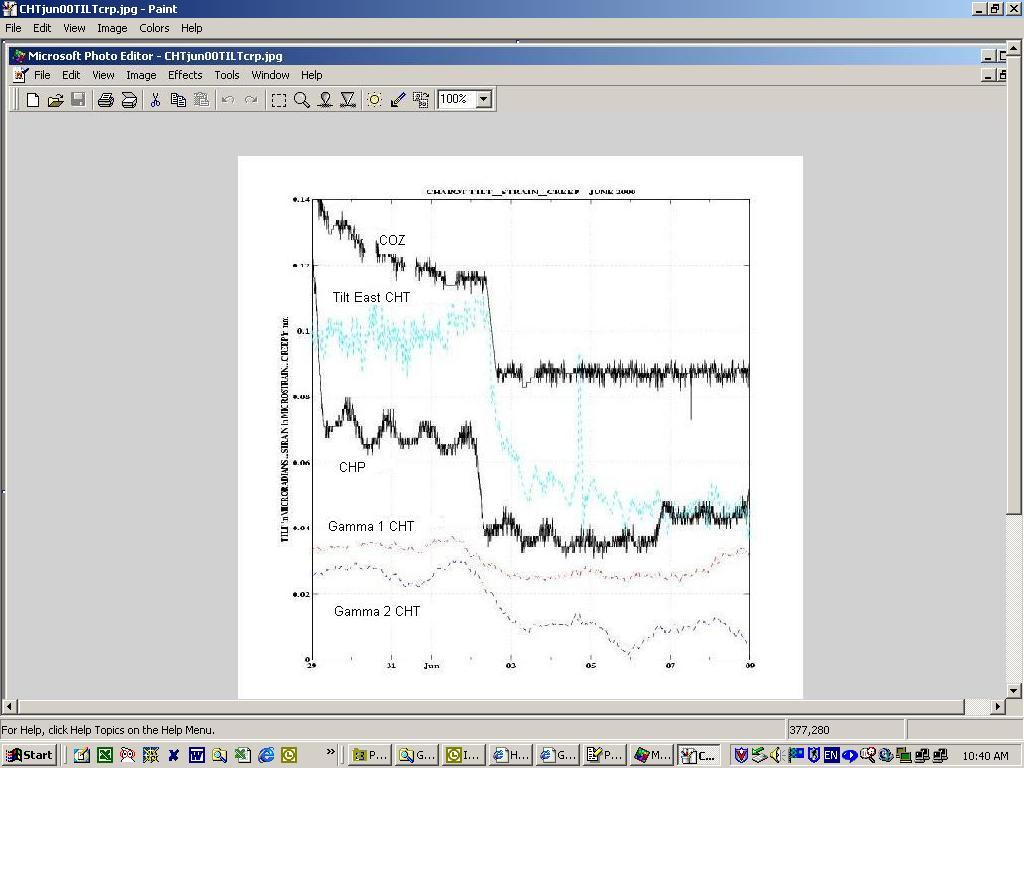
- June 1 - 2, 2001 Strain Tilt Creep: event
detail plot with tilt measured on the GTSM on-board tiltmeter.
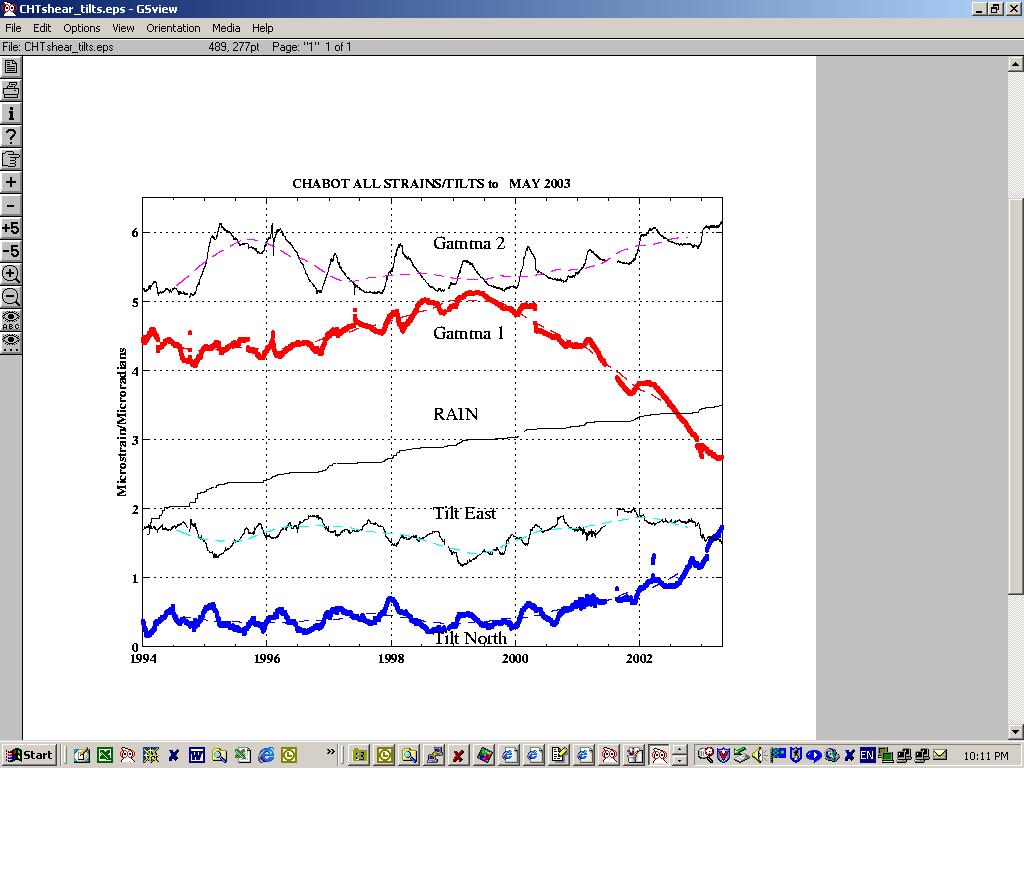
- ALL data to May 2003 Strain Tilt :
detail plot with tilt measured on the GTSM on-board tiltmeter.
Some other related sites :
|
