GTSM in SOUTHERN CALIFORNIA
High precision and high stability measurements
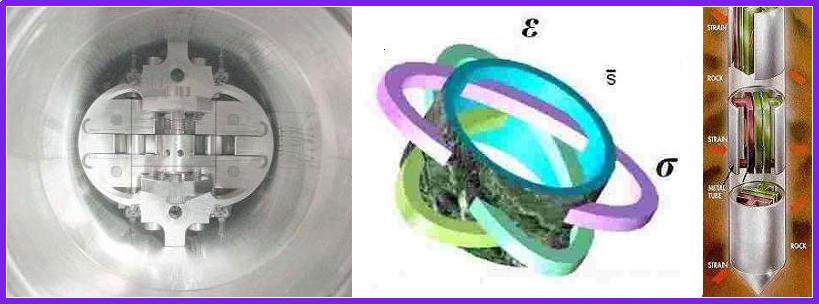
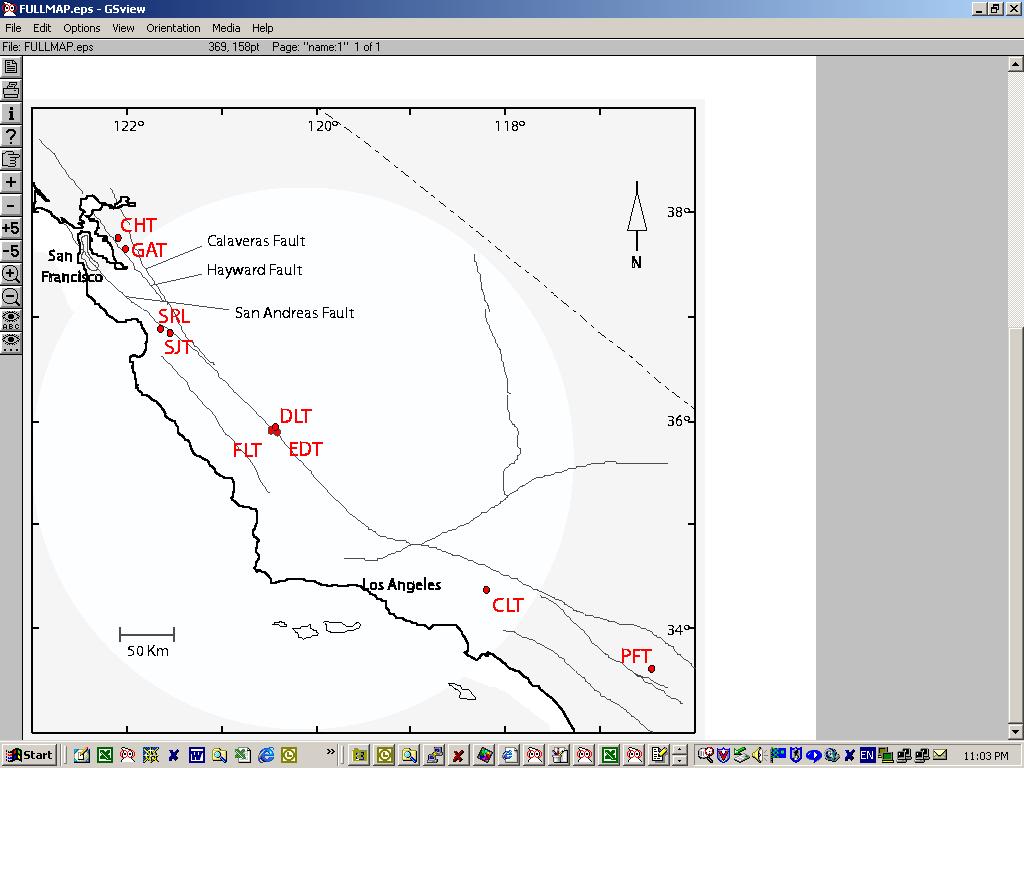
of the horizontal strain field in a region are made in California
using a Borehole Tensor Strain Measurement instrument (BTSM). These instruments
are installed at a depth of 100-200 metres at 7 sites in California. The
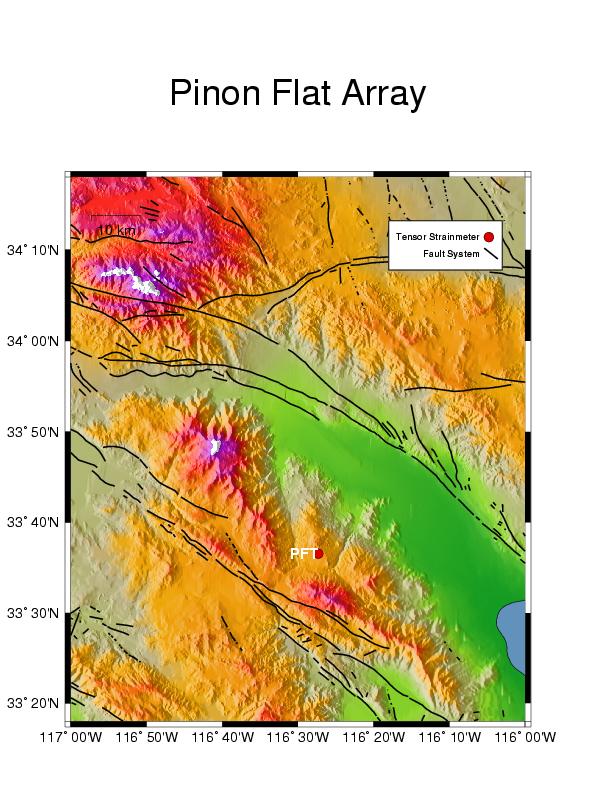
sites are shown in red in the accompanying map.
-
PFT is situated at the Pinon
Flat Observatory in the mountains southwest of Palm Desert
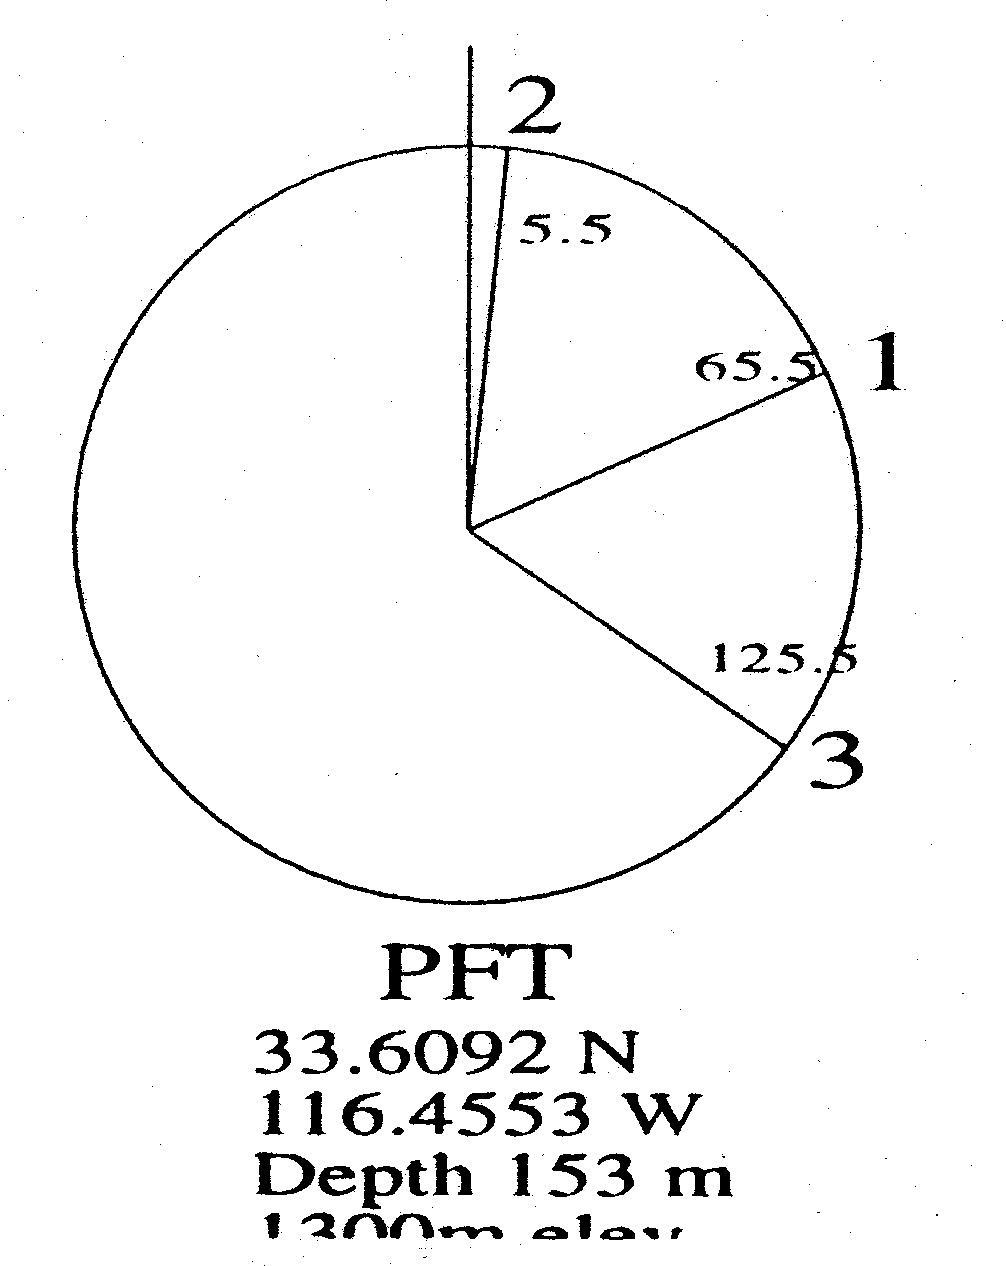
Gauge angles
- 1. 65.5 E of N
- 2. 5.5 E of N
- 3. 125.5 E of N
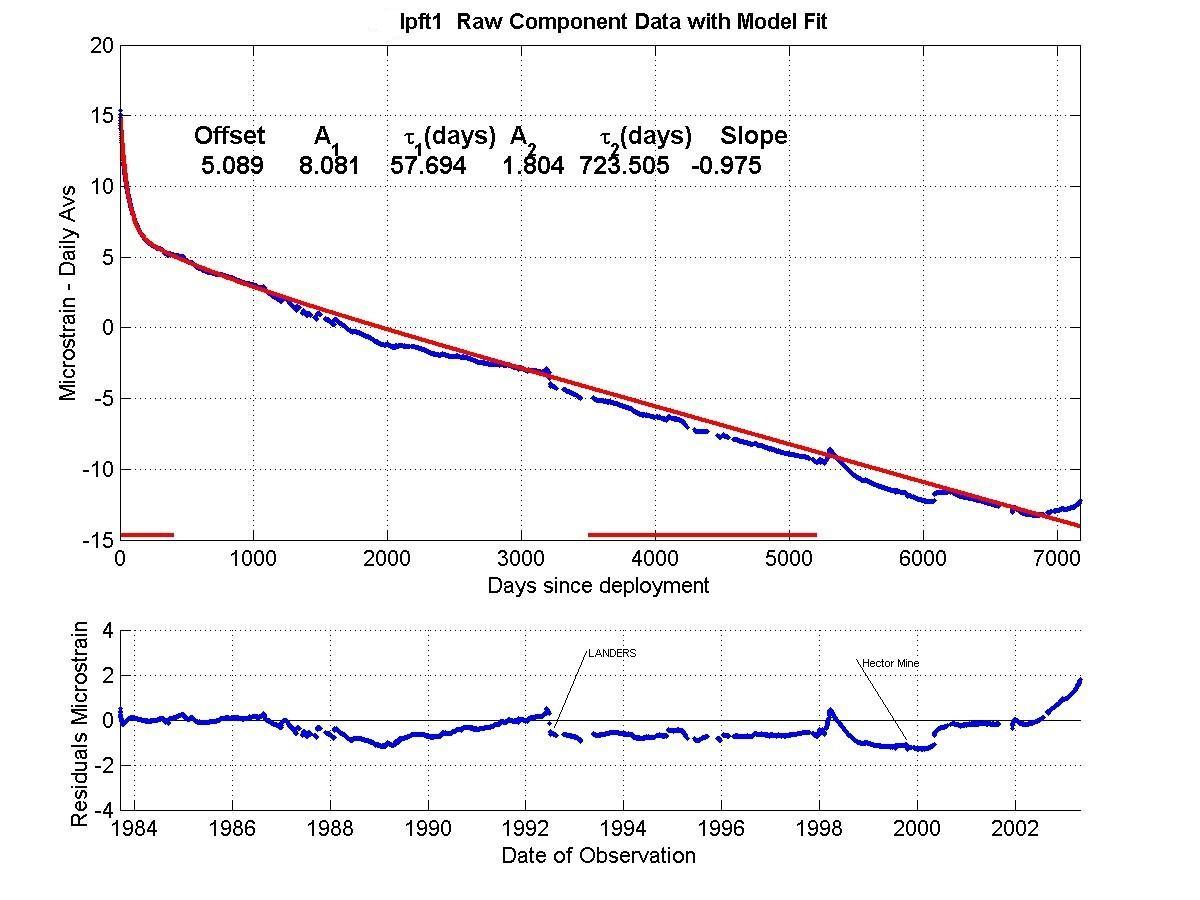
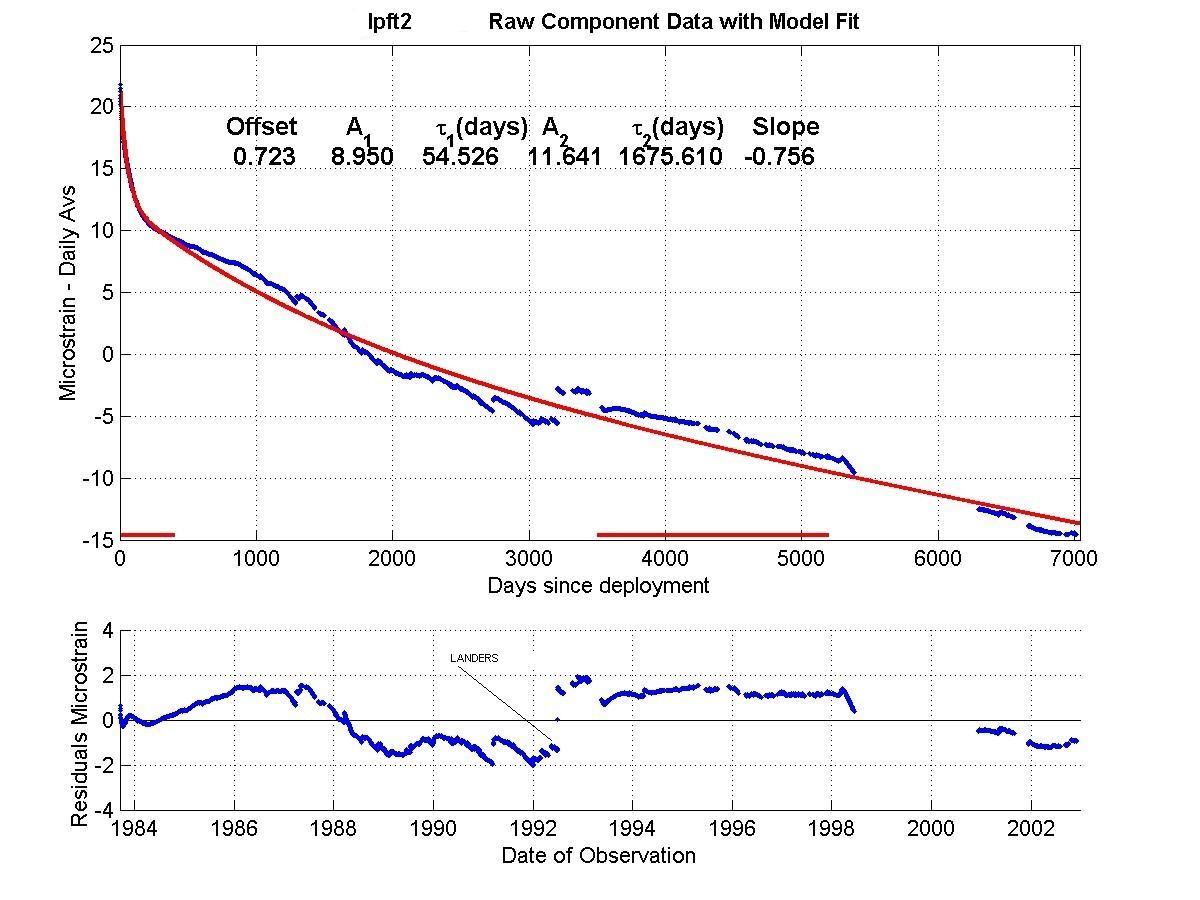
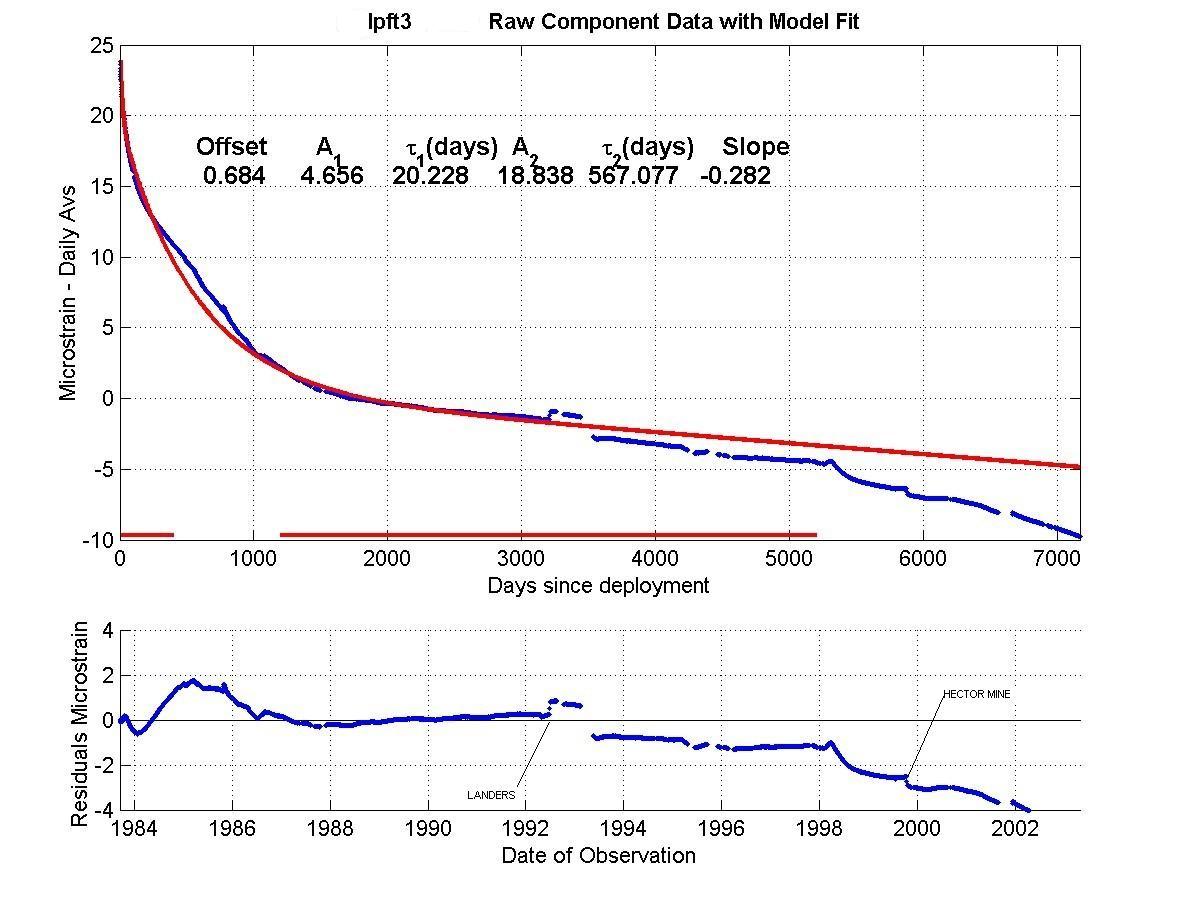
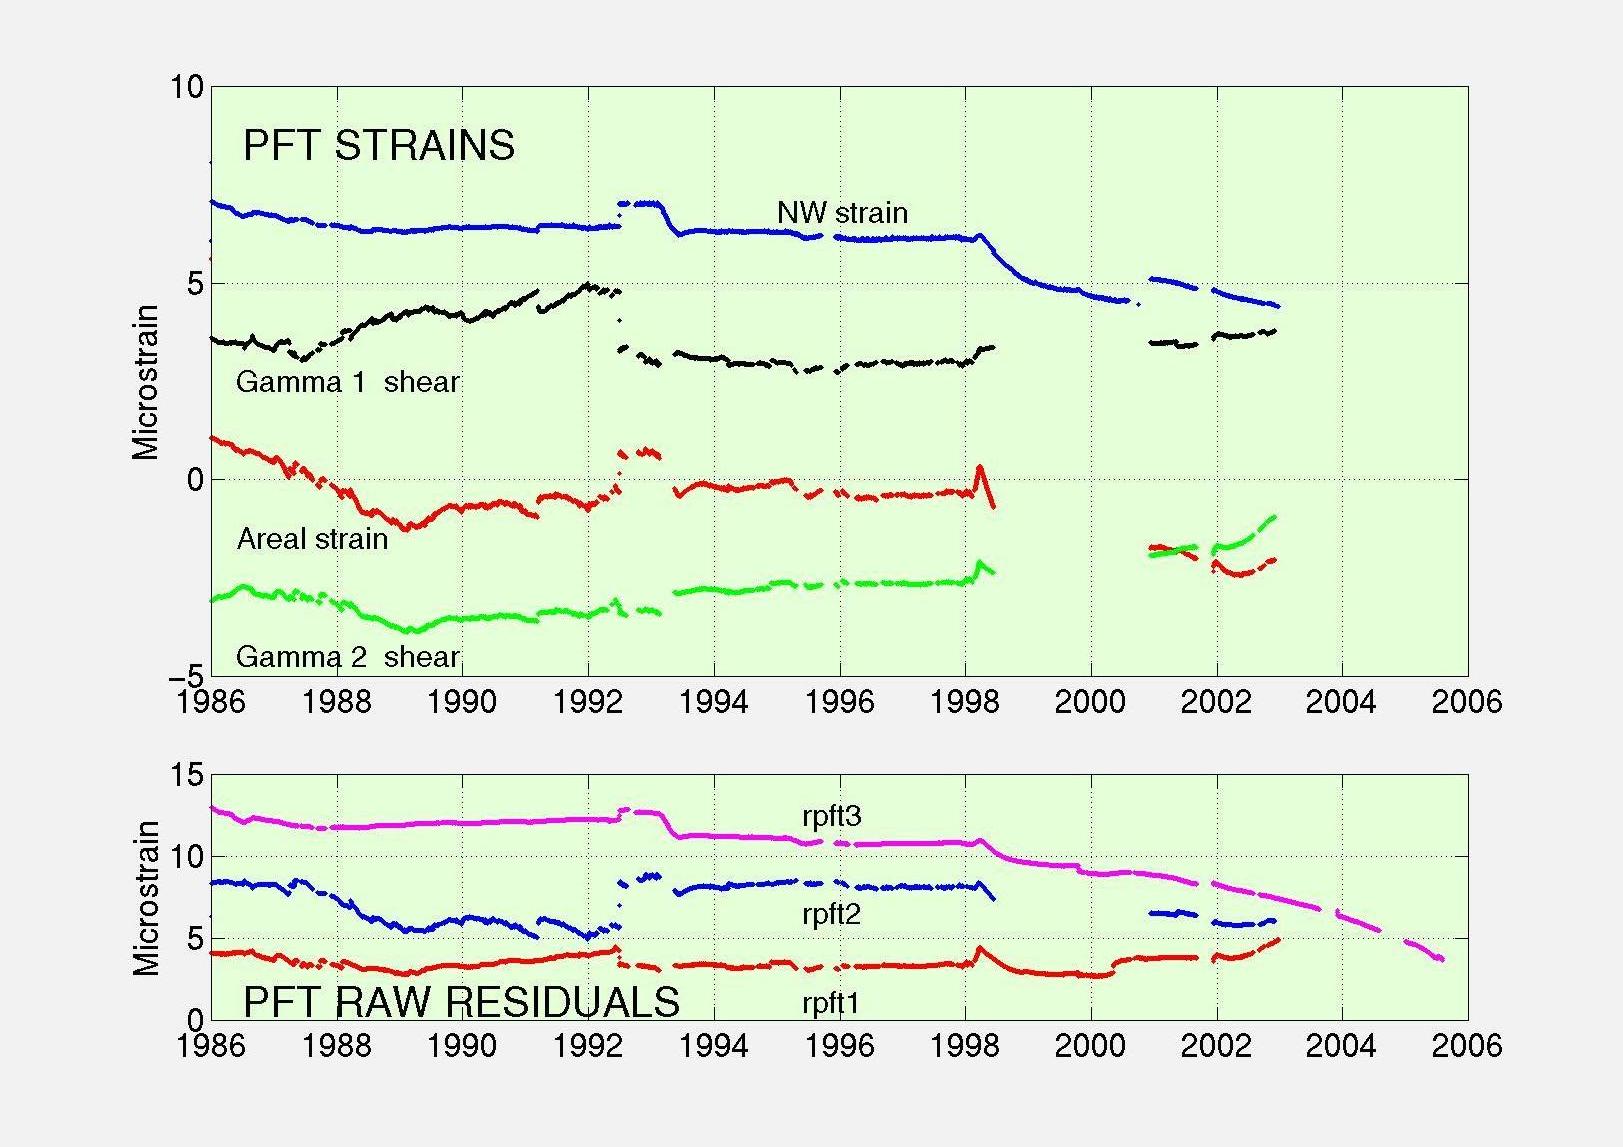
Raw, exponential models, and residual plots for each measured
channel are shown for gauge
1, gauge 2, and for
gauge 3.
Note that the gauge residuals have a Y axis scale range of +/- 4
microstrain for each component, and show that excluding known tectonic
events, all variation in gauge strain rates have been less than
+/- 0.6 microstrain per year for the period 1987 - 1998, for which
the integrity of the instrument is intact, of the 20 year record..
The residual linear borehole recovery strain rate over the total
record is shown in microstrain/year as the "slope" on each plot.
Residual data are recovered from the raw data by extracting least
squares fitted exponential(s) and a linear function which describe
the processes of curing of the grout and recovery of the borehole,
after drilling and installation disturbance of the virgin stress field.
Regions used in the least squares fitting are marked in red on the
X axis, and the fit parameters are printed in the upper panelof
the figure and are also tabulated
elsewhere.
In August 2003, the borehole recovery exponentials
were updated from values determined in the early 1990's to incorporate
the additional 10 years of data length now available. Changes of
strain rates calculated from these residuals are unaffected by the
exponential removal procedure and allow the very long term stability(see
gauge 1 , gauge 2, and
gauge 3) of the instruments to be quantified.
.
HISTORY
The PFT site was originally occupied in 1983 for a comparative investigation
of GTSM instruments with 2 Sacks-Everton dilatometers and the UCSD long
baseline laser interferometer.
The Sacks-Everton systems failed before any long term comparison could
be made.
Two of the three components of the UCSD laser strainmeter are too unstable
to allow direct comparison of long and short baseline instruments for
anything but tidal measurements.
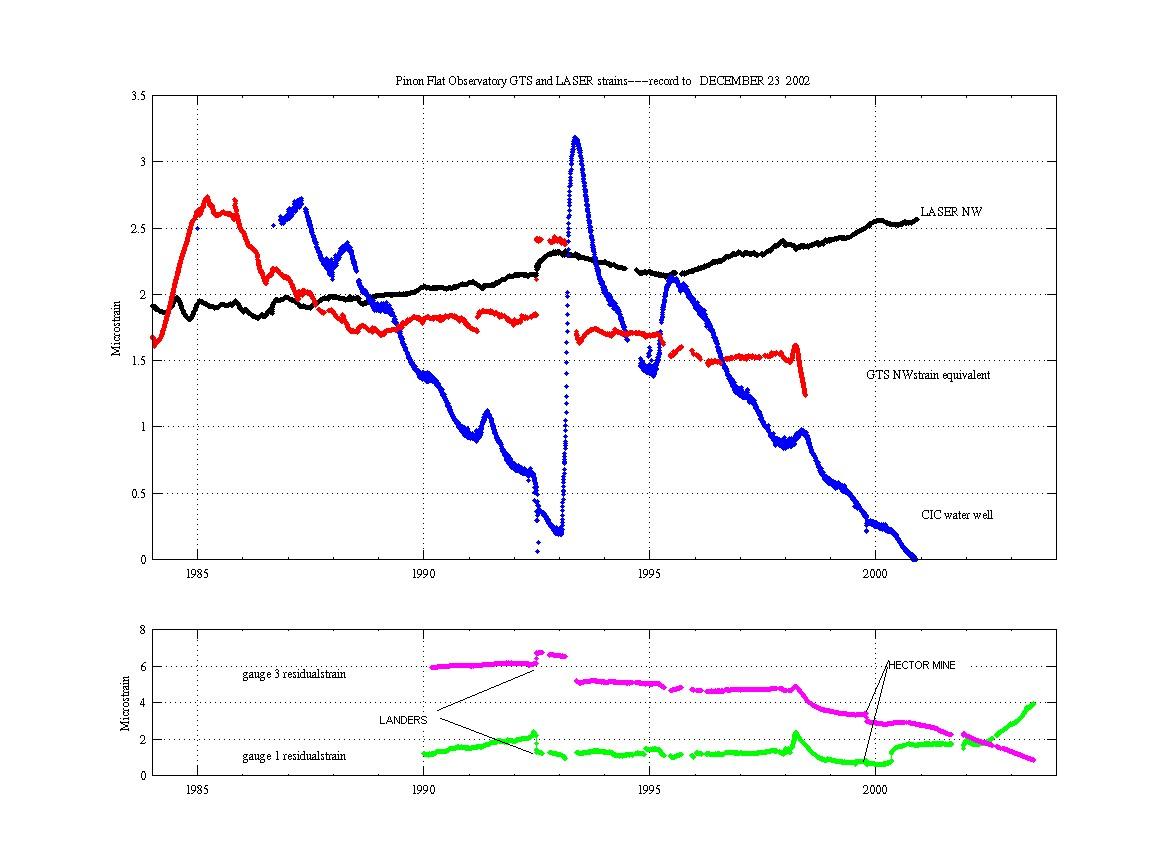
This leaves only the SE/NW (optically anchored) laser component for the
comparison.
The SE/NW laser data are (supplied by Wyatt and Agnew) compared
with the SE/NW strain inferred from the 3 component GTSM borehole
data.
For the 10 year period 1988-1998, variation of the measured strain rate
of the GTSM (after removal of the exponential and linear hole recovery
effects) is less than 50 ne/year from the absolute strain rate identified
by the LSM. This is an important and fundamental result which confirms
the long term stability of the GTSM system
Both instruments show the influence of the CIC water level to different
degrees
The GTSM data includes all major earthquake steps (Landers, HectorMine{channels
2 and 3}) which are not included in the LSM data because of loss of line
lock during the seismic wave arrivals.
A calibration method that incorporates cross coupling of remote areal/shear
strains into instrument areal/shear strains has brought strain tides measured
by the Pinon Flat GTSM (borehole diameter 200mm) into very good agreement
with strain tides independently measured by the co-located LSM (dimensions
~1km). The cross coupled calibration has also yielded good agreement between
the GTSM observations of the 1992 Landers earthquake and geodesy-based
modeling, and co-located EDM measurements (Hart,Gladwin,Gwyther,Agnew
and Wyatt 1996).
The short baseline GTSM instrument shows higher short period noise than
the LSM throughout the record, as is to be expected.
One of the three channels (gauge 2) in the Pinon Flat BTSM instrument
has suffered significant degradation in gain from 1998 onwards, due to
component failure in the downhole preamp (after 15 years of continuous
operation and several lightning strikes) . The internal gain compensation
system ran out of dynamic range in mid-2000. In December 2000 an uphole
gain compensating circuit was installed on channel 2 in an attempt to
continue normal operation to extend the 18 year dataset . September 1,
2001 produced another massive electrical storm after which all instruments
at PFO were disabled. Again repairs were attempted during the December
2001 field trip, and again in late May 2002, but degradation has continued.
It is considered that this site is now irrecoverable.
Review of the field repair notes for the life of this instrument reveals
that by December 1997, damage to the downhole system was suspected. Though
failure of the gain compensation system occurred mid 1998, all channels
post this date are suspect, because these pre-1980 instruments passively
share bridge drive systems across channels downhole. Though normal tidal
data is still evident on channels 1 and 3, long term stability is compromised.
It is intended to continue maintenance and data archiving of the remaining
channels at this site,
while processes to reduce the site to a single channel instrument are
investigated.
- For PFT, raw data is in instrument counts
- linearised data is in nominal nanostrain
- strain data is in microstrain
-
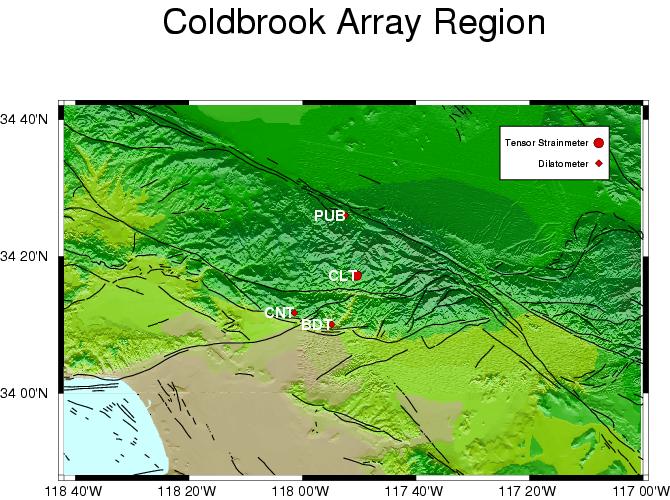
CLT is situated in the San
Gabriel mountains region
installed in late December 1996 as part of a 4 instrument borehole strain
array,with Sacks-Evertson dilatometers Chantry (CN, 15km southwest of
CLT), Big Dalton (BD, 15 km southeast of CLT), and with PUBA having
been installed to the north in 1984.
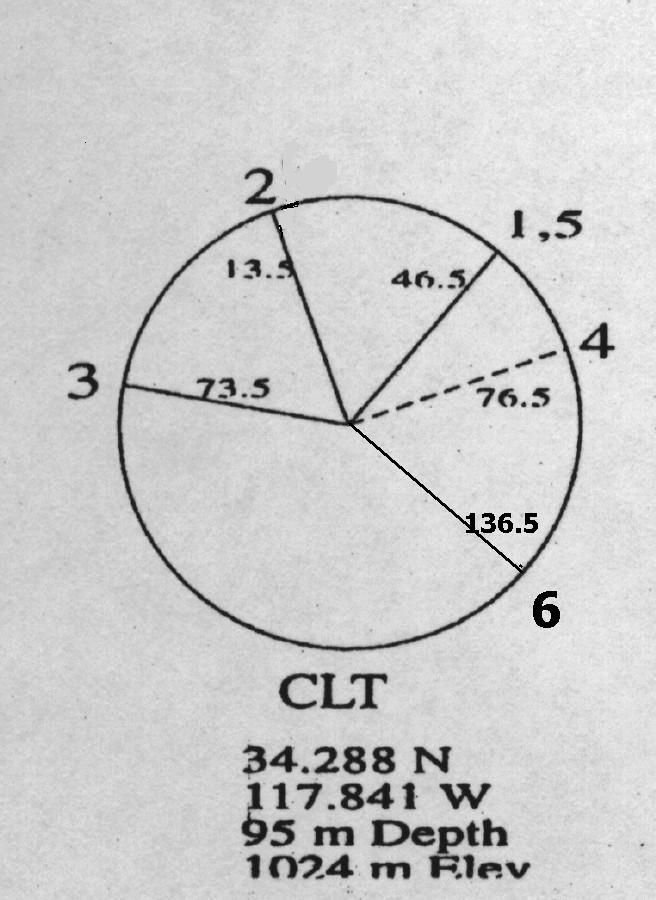
Gauge angles
- 1. 46.5 E of N
- 2. 166.5 E of N
- 3. 106.5 E of N
- 4. 76.5 E of N
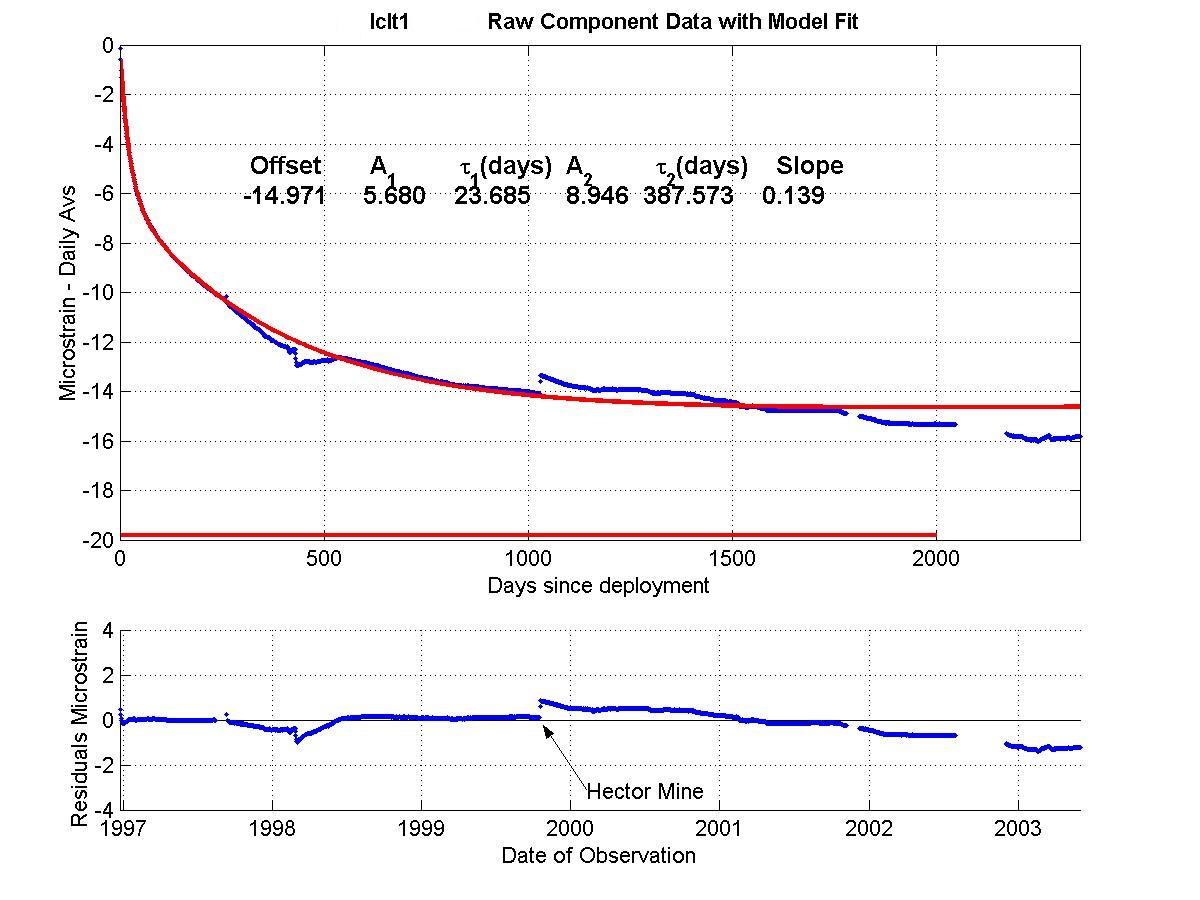
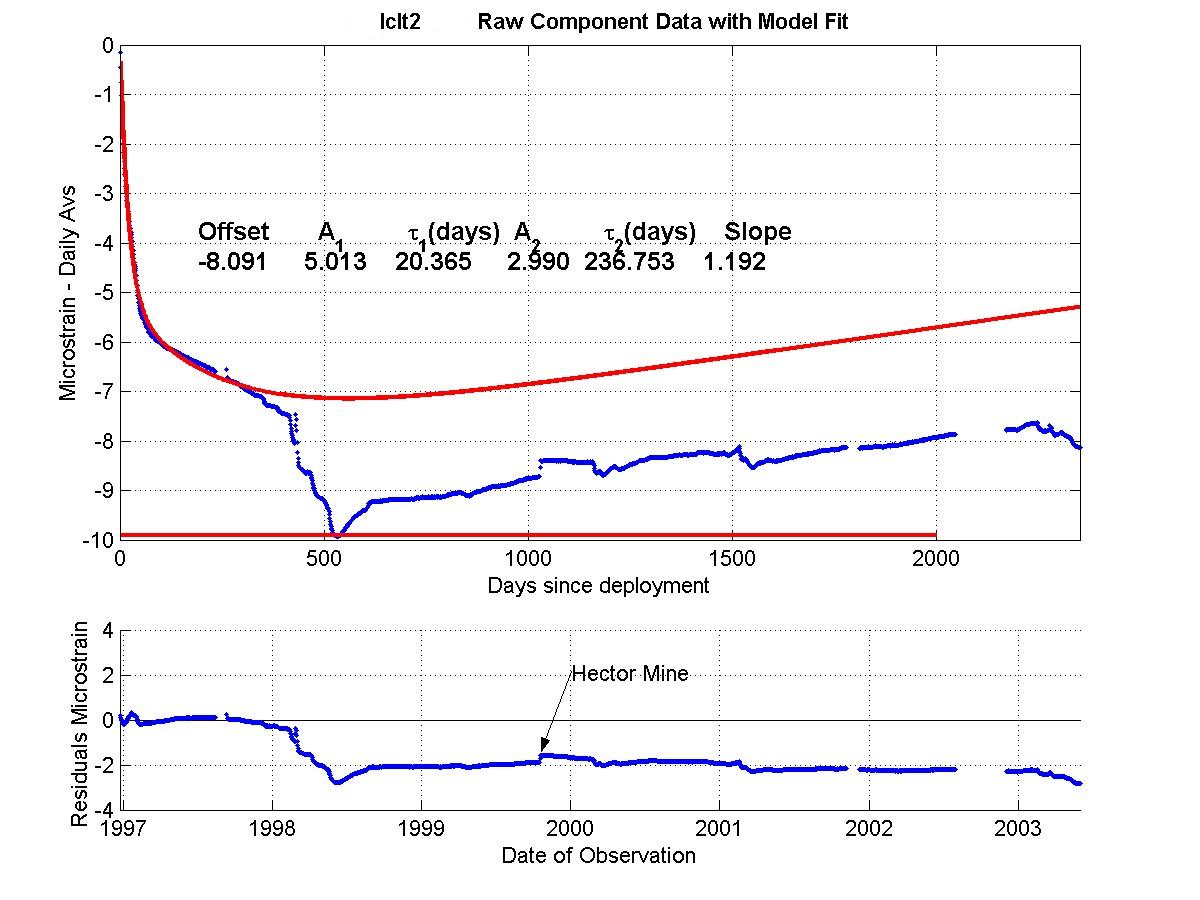
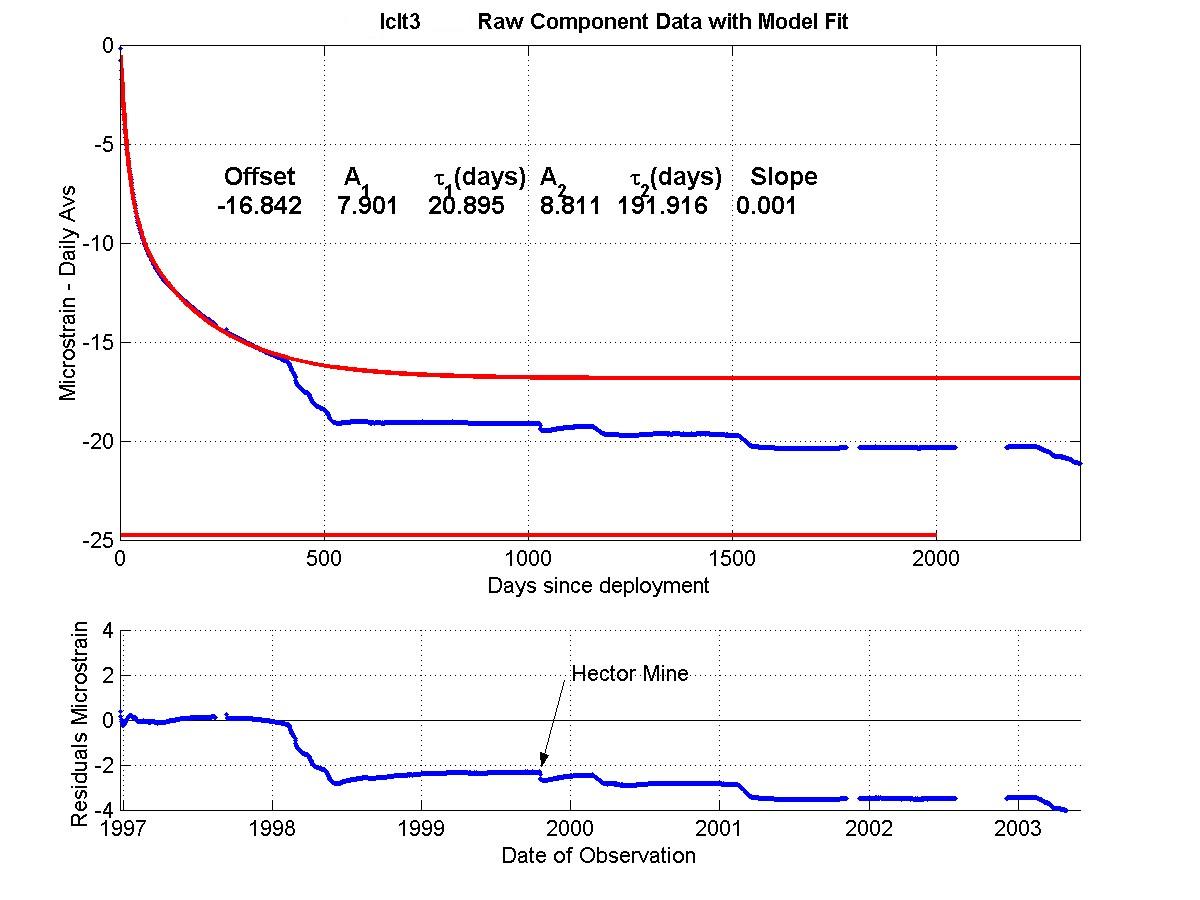
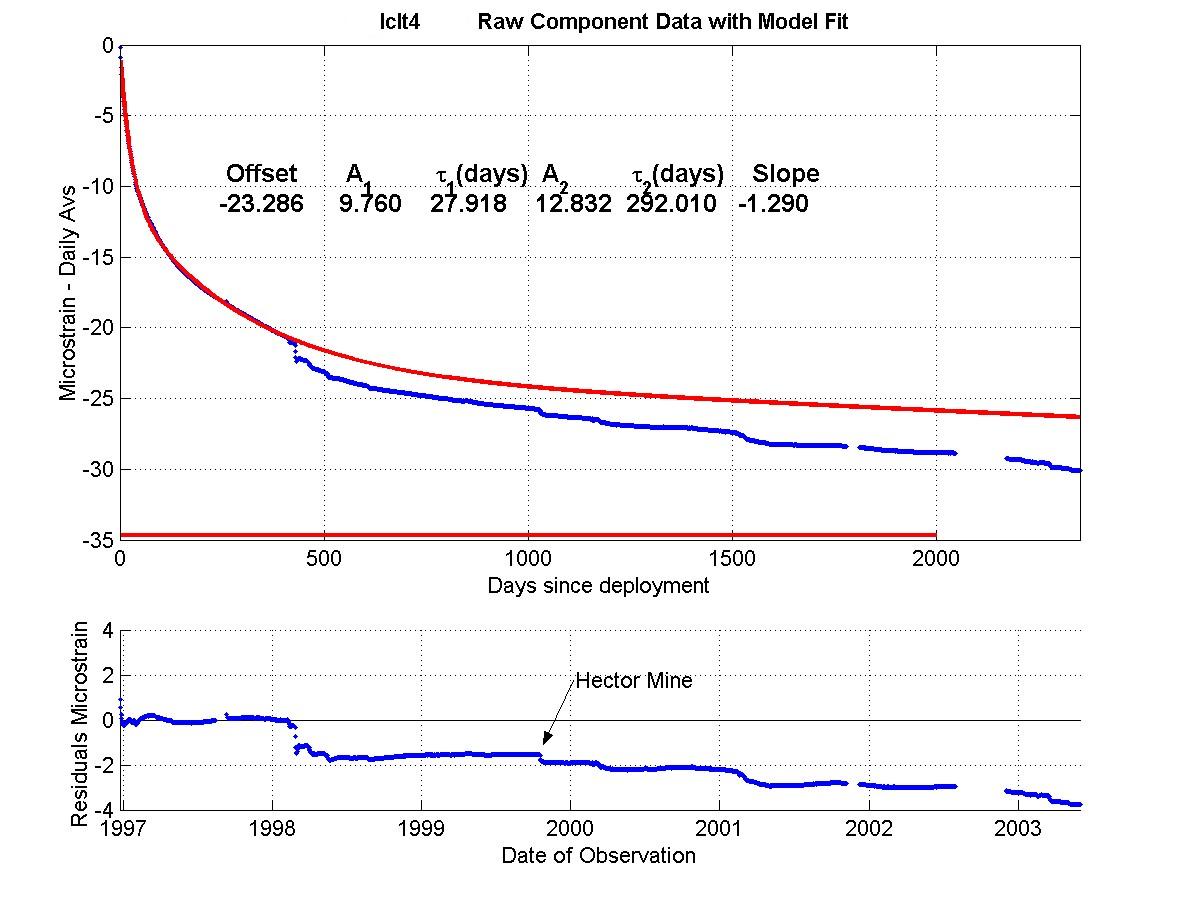
Raw, exponential models, and residual plots for each measured
channel are shown for gauge 1,
for gauge 2, for gauge
3, and for gauge 4.
Note that the gauge residuals have a Y axis scale range of +/- 4 microstrain
for each component, and show that excluding known tectonic events, and
a large local transient offset measured on all strain and tilt channels
late in the 1998 rain season, all variation in gauge strain rates have
been less than +/- 0.2 microstrain per year over the record..
The residual linear borehole recovery strain rate over the total record
is shown in microstrain/year as the "slope" on each plot.
Residual data are recovered from the raw data by extracting least squares
fitted exponential(s) and a linear function which describe the processes
of curing of the grout and recovery of the borehole, after drilling and
installation disturbance of the virgin stress field.
Regions used in the least squares fitting are marked in red on the X
axis, and the fit parameters are printed in the upper panelof the
figure and are also tabulated
elsewhere.
In August 2003, the borehole recovery exponentials
were updated from values determined in the early 1990's to incorporate
the additional years of data length now available. Changes of strain
rates calculated from these residuals are unaffected by the exponential
removal procedure and allow the very long term stability(see
gauge 1 , gauge 2,
gauge 3,and gauge 4)of the instruments
to be quantified.
.
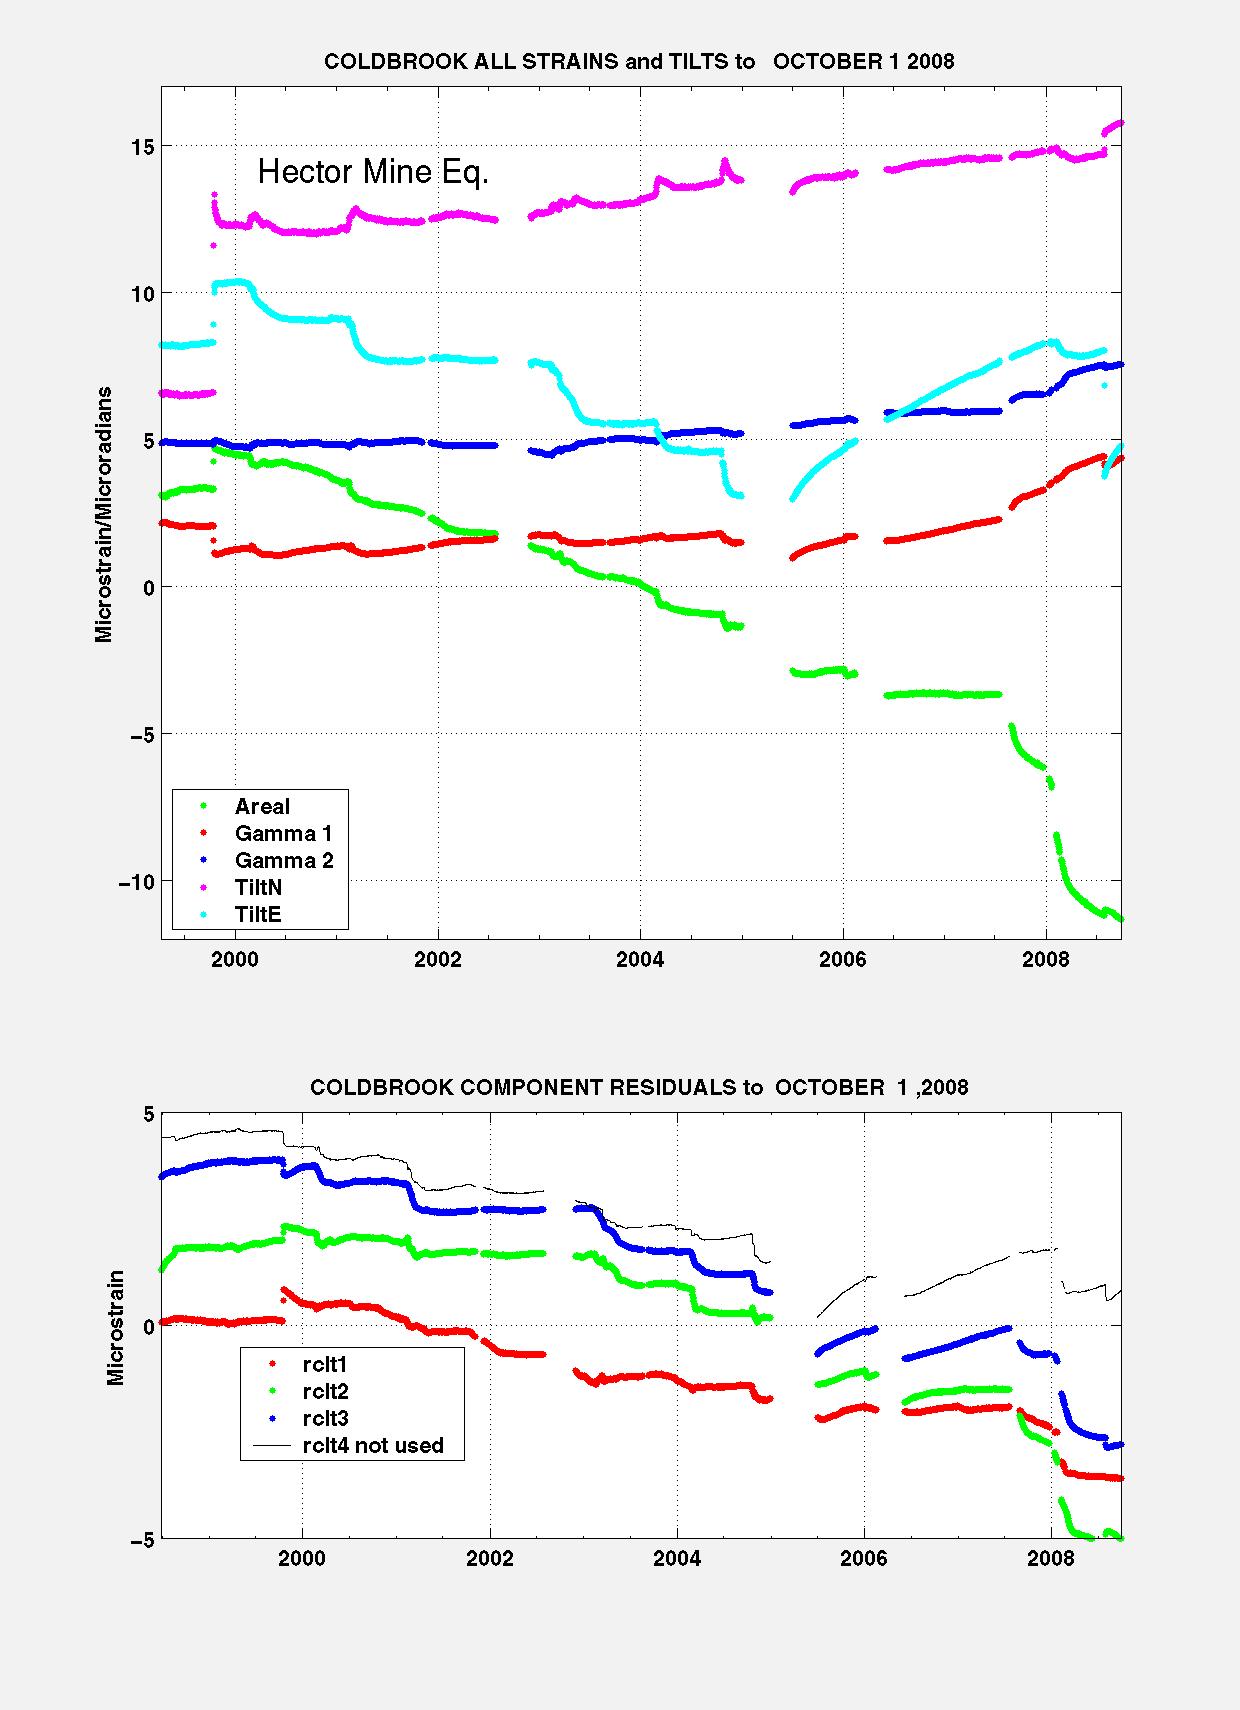
These instruments provide strain data on
- Long term strain accumulation. Long term data records from
the from these two instruments,PFT and
CLT are available . Also available from
the CLT instrument is Borehole Tilt
data.
- Medium term strain changes associated with earthquake activity
and other fault processes.
- Coseismic strain offsets useful for constraining earthquake
source mechanisms.
- For CLT, raw data is in instrument counts
- linearised data is in nominal nanostrain
- STRAIN DATA IS IN NANOSTRAIN for this site only
Some other related sites :
|
