GTSM TECHNOLOGIES
|
|
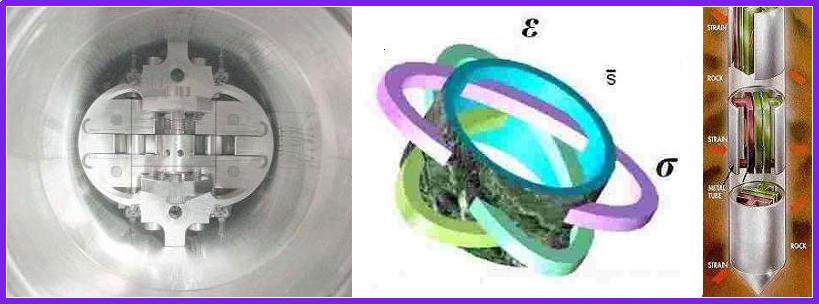
GTSM in Mining Borehole strain instruments provide
nanostrain sensitivity for measurement of three components of the
horizontal plane strain induced by tectonic or engineering processes.
Earth tilt measurement at nanoradian sensitivity may also be
included in the instrument modules. Data is available at the measurement
site in near real time, and can be used to monitor elastic failure
or rock creep processes over extended periods of time. Instruments
are installed from the surface in vertical boreholes.
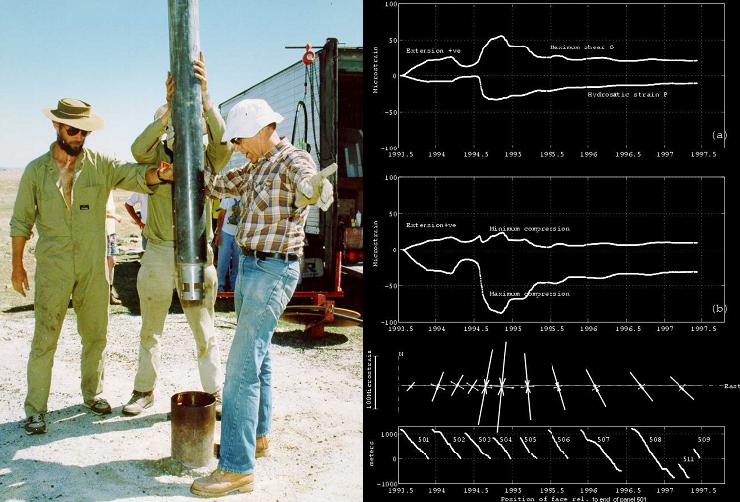
Two examples of strains measured on an instrument installed above a longwall coal mining operation are shown below. The coal seam is at a depth of 450 m and the instrument is installed at 50m depth to remove contamination of data by surface effects. The first plot shows strains observed as the longwall panels, with a length of approx. 1000m and separation of 100m, are progressively mined. Uniaxial compression strains perpendicular to the panels are evident as mining passes underneath. During this phase, strain accumulation is readily correlated with mining activity, as shown in the second plot.
This figure above gives representative output from a longwall excavation monmitoring exercise. The upper plot shows the tensor components exx , eyy and exy , referenced to the unmined state. The lower plot shows the position of the advancing longwalls measured from the western end of each panel. The centre panel indicates the principal axes interpretation of the strain sequences at each point in time marked with a principal axis plot. Arrowheads on the principal st rain axes give the direction of strain, and the azimuth of the axis plot gives its no rmal geographic azimuthal orientation (east to the right, north up). The rotations of the principal axes as the mining sequence occurs are clearly indicated. The scale bar to the left of the sequence indicates 100 microstrain.
This figure shows a detail of strain meter response to longwall operations over a 12 day period during which the longwall mining activity passed directly beneath the sensor at a depth of 400 m. The periods of longwall activity are shaded. The major strain changes induced by the mining are restricted essentially to the period of longwall activities. Note that they reflect the fact that the cutting occurs in two shifts separated by a short shift change interval which can clearly be identified. The figure indicates the direct causal relationship of the observed loads to mining operations. Detailed examination indicates that the immediate elastic response followed by a short term plastic response consistent with expectations from subsidence data. Tilt Measurements
As the long wall miner passes under the instrument, one can seen the approach of the miner to the near site CCT in the centre plot, and to the further away site CAT in the upper plot. The lower plot represents the panel being mined below the instrments relative to the 2 instruments. The corresponding strain plot for the near site CCT is to be seen above. GTSM tiltmeters have not been installed in either the PBOT locations, nor in the strainmeters funded by NSF in the Plate Boundary Observatory program of Earthscope for UNAVCO to this time. GTSM tiltmeters, one monofilamentary (1996) and two polyfilamentary (1992) have been installed previously in the NEHRP in California.
Future Applications
|
| Homepage
| |
| Gladwin Tensor Strain Meter Technologies
Pty. Ltd. URL http://gtsmtechnologies.com/public/index.html Contact:gtsmtech Last modification: June 19, 2005 |