|
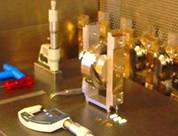
GTSM at Tsungwen Reservior, Taiwan Eighteen Curves (ECT-) |
|
ECT is close to Chi Chien and to the south of Taipei, as the third GTSM installed in a prospective array in Taiwan by the Central Geological Survey of Taiwan.
ECT is a mains powered site, and has telephone connectivity. The standard dialup connection is unreliable and very slow. Some effort is being put into obtaining ADSL for this station.
The borehole was producing water at the time of installation (artesian) which may be the cause of many anomalies which can be seen in the data.
Gauge angles #0. 225.5 E of N #1. 165.5 E of N #2. 105.5 E of N #3. 75.5 E of N
These instruments provide 3 component strain data on Long term raw data accumulation.
Early data records at this site (ECT) are available. Coseismic strain offsets useful for constraining earthquake source mechanisms.
Raw, exponential models, and residual plots for each measured channel are shown for:
Note that the gauge residuals have a Y axis scale range of +/- 5 microstrain for each component, and show that excluding known tectonic events, all variation in gauge strain rates have been less than +/- 0.5 microstrain per year for the whole of the current record.
The residual linear borehole recovery strain rate over the total record is shown in microstrain/year as the "slope" on each plot.
Residual data are recovered from the raw data by extracting least squares fitted exponential(s) and a linear function which describe the processes of curing of the grout and recovery of the borehole, after drilling and installation disturbance of the virgin stress field.
Regions used in the least squares fitting are marked in red on the X axis, and the fit parameters are printed in the upper panel of the figure.
Zoomed plot of detrended component data from this site is shown for ECT.
Data plots of interest:
May 19, 2004, at RST Mag 6.5 Taitung : event detail plot. This event was captured on the 1 second recording rate, before enabling of higher resolution collection.
May 19, 2004, at RNT Mag 6.5 Taitung : event detail plot. This event was captured on the 100Hz recording rate, after enabling of higher resolution collection in early May 2004.
May 19, 2004, at ECT Mag 6.5 Taitung : event detail plot. This event was captured on the 100Hz recording rate, after enabling of higher resolution collection in early May 2004.
Here is a map showing location of GTSMs with respect to the Taitung earthquake.
The initial report on this work has been published elsewhere. |